Posts on psychometrics: The Science of Assessment

psychometric data forensics

An emerging sector in the field of psychometrics is the area devoted to analyzing test data to find cheaters and other illicit or invalid testing behavior. We lack a generally agreed-upon and marketable term for that sort of work, and I’d like to suggest that we use Psychometric Forensics.

While research on this topic is more than 50 years old, the modern era did not begin until Wollack published his paper on the Omega index in 1997. Since then, the sophistication and effectiveness of methodology in the field has multiplied, and many more publications focus on it than in the pre-Omega era. This is evidenced by not one but three recent books on the subject:

  1. Wollack, J., & Fremer, J. (2013).  Handbook of Test Security.
  2. Kingston, N., & Clark, A. (2014).  Test Fraud: Statistical Detection and Methodology.
  3. Cizek, G., & Wollack, J. (2016). Handbook of Quantitative Methods for Detecting Cheating on Tests.

In addition, there was the annual Conference on the Statistical Detection of Test Fraud, which recently changed its name to the Conference on Test Security.

I’m excited about the advances being made, but one thing has always bugged me about this: the name, or lack thereof. There is no name that’s relatively accepted for the topic of statistical detection. Test Security is a good name for the broader topic, which also includes things like security policies for test centers. But not for the data side. You can see that the 2014 and 2016 books as well as the original conference title all have similarity, but don’t agree, which I think in part is because the names are too long and lack the modern marketing oomph. Just like the dreadful company names of the 1960s and 1970s… stuff like Consolidated International Business Logistics Incorporated. No wonder so many companies changed to acronyms in the 1980s.

As I thought about this, I began by laying down my requirements for what I would want in the name:

  1. Short enough to not be a mouthful – preferably two words max
  2. Descriptive enough to provide some initial idea what it is
  3. Not already taken elsewhere (the use of “certification management” in the testing industry is a great example of this failure)
  4. Wide enough to cover cases that are not fraud/malicious but still threats to validity

Statistical Detection of Test Fraud or configurations of it pass Requirements 2 and 3, but certainly fail 1 and 4. Conversely, Data Forensics or similar terms would pass Requirements 1 and 4, but fail 2 and 3 quite badly. I’m also guilty, by naming my software program Software for Investigating Fraud in Testing – mostly because I thought the acronym SIFT fit so well.

I’d like to suggest the term Psychometric Forensics. This meets all 4 requirements, at least within the testing industry (we’re still fighting that uphill battle to get the rest of the world to even understand what psychometrics is). A quick Google search does not find hits, and only finds two instances of psychometric data forensics, which are buried in technical reports that primarily use the term data forensics.

However, I’m not completely sold on it.  Any other suggestions?  I’d love to hear them!

student-profile-cognitive-diagnostic-models

Cognitive diagnostic models are an area of psychometric research that has seen substantial growth in the past decade, though the mathematics behind them, dating back to MacReady and Dayton (1977).  The reason that they have been receiving more attention is that in many assessment situations, a simple overall score does not serve our purposes and we want a finer evaluation of the examinee’s skills or traits.  For example, the purpose of formative assessment in education is to provide feedback to students on their strengths and weaknesses, so an accurate map of these is essential.  In contrast, a professional certification/licensure test focuses on a single overall score with a pass/fail decision.

What are cognitive diagnostic models?

The predominant psychometric paradigm since the 1980s is item response theory (IRT), which is also known as latent trait theory.  Cognitive diagnostic models are part of a different paradigm known as latent class theory.  Instead of assuming that we are measuring a single neatly unidimensional factor, latent class theory instead tries to assign examinees into more qualitative groups by determining whether they categorized along a number of axes.

What this means is that the final “score” we hope to obtain on each examinee is not a single number, but a profile of which axes they have and which they do not.  The axes could be a number of different psychoeducational constructs, but are often used to represent cognitive skills examinees have learned.  Because we are trying to diagnose strengths vs. weaknesses, we call it a cognitive diagnostic model.

Example: Fractions

A classic example you might see in the literature is a formative assessment on dealing with fractions in mathematics. Suppose you are designing such a test, and the curriculum includes these teaching points, which are fairly distinct skills or pieces of knowledge.

  1. Find the lowest common denominator
  2. Add fractions
  3. Subtract fractions
  4. Multiply fractions
  5. Divide fractions
  6. Convert mixed number to improper fraction

Now suppose this is one of the questions on the test.

 What is 2 3/4 + 1 1/2?


This item utilizes skills 1, 2, and 6.  We can apply a similar mapping to all items, and obtain a table.  Researchers call this the “Q Matrix.”  Our example item is Item 1 here.  You’d create your own items and tag appropriately.

Item Find the lowest common denominator Add fractions Subtract fractions Multiply fractions Divide fractions Convert mixed number to improper fraction
 Item 1  X X  X
 Item 2  X  X
 Item 3  X  X
 Item 4  X  X


So how do we obtain the examinee’s skill profile?

This is where the fun starts.  I used the plural cognitive diagnostic models because there are a number of available models.  Just like in item response theory we have the Rasch, 2 parameter, 3 parameter, generalized partial credit, and more.  Choice of model is up to the researcher and depends on the characteristics of the test.

The simplest model is the DINA model, which has two parameters per item.  The slippage parameter s refers to the probability that a student will get the item wrong if they do have the skills.  The guessing parameter g refers to the probability a student will get the item right if they do not have the skills.

The mathematical calculations for determining the skill profile are complex, and are based on maximum likelihood.  To determine the skill profile, we need to first find all possible profiles, calculate the likelihood of each (based on item parameters and the examinee response vector), then select the profile with the highest likelihood.

Calculations of item parameters are an order of magnitude greater complexity.  Again, compare to item response theory: brute force calculation of theta with maximum likelihood is complex, but can still be done using Excel formulas.  Item parameter estimation for IRT with marginal maximum likelihood can only be done by specialized software like  Xcalibre.  For CDMs, item parameter estimation can be done in software like MPlus or R (see this article).

In addition to providing the most likely skill profile for each examinee, the CDMs can also provide the probability that a given examinee has mastered each skill.  This is what can be extremely useful in certain contexts, like formative assessment.

How can I implement cognitive diagnostic models?

The first step is to analyze your data to evaluate how well CDMs work by estimating one or more of the models.  As mentioned, this can be done in software like MPlus or R.  Actually publishing a real assessment that scores examinees with CDMs is a greater hurdle.

Most tests that use cognitive diagnostic models are proprietary.  That is, a large K12 education company might offer a bank of prefabricated formative assessments for students in grades 3-12.  That, of course, is what most schools need, because they don’t have a PhD psychometrician on staff to develop new assessments with CDMs.  And the testing company likely has several on staff.

On the other hand, if you want to develop your own assessments that leverage CDMs, your options are quite limited.  I recommend our  FastTest  platform for test development, delivery, and analytics.

This is cool!  I want to learn more!

I like this article by Alan Huebner, which talks about adaptive testing with the DINA model, but has a very informative introduction on CDMs.

Jonathan Templin, a professor at the University of Iowa, is one of the foremost experts on the topic.  Here is his website.  Lots of fantastic resources.

This article has an introduction to different CDM models, and guidelines on estimating parameters in R.

Guttman errors are a concept derived from the Guttman Scaling approach to evaluating assessments.  There are a number of ways that they can be used.  Meijer (1994) suggests an evaluation of Guttman errors as a way to flag aberrant response data, such as cheating or low motivation.  He quantified this with two different indices, G and G*.

What is a Guttman error?

It occurs when an examinee answers an item incorrectly when we expect them to get it correct, or vice versa.  Here, we describe the Goodenough methodology as laid out in Dunn-Rankin, Knezek, Wallace, & Zhang (2004).  Goodenough is a researcher’s name, not a comment on the quality of the algorithm!

In Guttman scaling, we begin by taking the scored response matrix (0s and 1s for dichotomous items) and sorting both the columns and rows.  Rows (persons) are sorted by observed score and columns (items) are sorted by observed difficulty.  The following table is sorted in such a manner, and all the data fit the Guttman model perfectly: all 0s and 1s fall neatly on either side of the diagonal.


  Score Item 1 Item 2 Item 3 Item 4 Item 5
P =   0.0 0.2 0.4 0.6 0.8
Person 1 1 1 0 0 0 0
Person 2 2 1 1 0 0 0
Person 3 3 1 1 1 0 0
Person 4 4 1 1 1 1 0
Person 5 5 1 1 1 1 1


Now consider the following table.  Ordering remains the same, but Person 3 has data that falls outside of the diagonal.


  Score Item 1 Item 2 Item 3 Item 4 Item 5
P =   0.0 0.2 0.4 0.6 0.8
Person 1 1 1 0 0 0 0
Person 2 2 1 1 0 0 0
Person 3 3 1 1 0 1 0
Person 4 4 1 1 1 1 0
Person 5 5 1 1 1 1 1


Some publications on the topic are unclear as to whether this is one error (two cells are flipped) or two errors (a cell that is 0 should be 1, and a cell that is 1 should be 0).  In fact, this article changes the definition from one to the other while looking at two rows the same table.  The Dunn-Rankin et al. book is quite clear: you must subtract the examinee response vector from the perfect response vector for that person’s score, and each cell with a difference counts as an error.


  Score Item 1 Item 2 Item 3 Item 4 Item 5
P =   0.0 0.2 0.4 0.6 0.8
Perfect 3 1 1 1 0 0
Person 3 3 1 1 0 1 0
Difference 1 -1


Thus, there are two errors.

Usage of Guttman errors in data forensics

Meijer suggested the use of G, raw Guttman error count, and a standardized index he called G*:

G*=G/(r(k-r).


Here, k is the number of items on the test and r is the person’s score.

How is this relevant to data forensics?  Guttman errors can be indicative of several things:

  1. Preknowledge: A low ability examinee memorizes answers to the 20 hardest questions on a 100 item test. Of the 80 they actually answer, they get half correct.
  2. Poor motivation or other non-cheating issues: in a K12 context, a smart kid that is bored might answer the difficult items correctly but get a number of easy items incorrect.
  3. External help: a teacher might be giving answers to some tough items, which would show in the data as a group having a suspiciously high number of errors on average compared to other groups.

How can I calculate G and G*?

Because the calculations are simple, it’s feasible to do both in a simple spreadsheet for small datasets. But for a data set of any reasonable size, you will need specially designed software for data forensics, such as SIFT.

What’s the big picture?

Guttman error indices are by no means perfect indicators of dishonest test-taking, but can be helpful in flagging potential issues at both an individual and group level.  That is, you could possibly flag individual students with high numbers of Guttman errors, or if your test is administered in numerous separate locations such as schools or test centers, you can calculate the average number of Guttman errors at each and flag the locations with high averages.

As with all data forensics, though, this flagging process does not necessarily mean there is nefarious goings-on.  Instead, it could simply give you a possible reason to open a deeper investigation.

Generalized-partial-credit-model

What is a rubric? It’s a rule for converting unstructured responses on an assessment into structured data that we can use psychometrically.

Why do we need rubrics?

Measurement is a quantitative endeavor.  In psychometrics, we are trying to measure things like knowledge, achievement, aptitude, or skills.  So we need a way to convert qualitative data into quantitative data.  We can still keep the qualitative data on hand for certain uses, but typically need the quantitative data for the primary use.  For example, writing essays in school will need to be converted to a score, but the teacher might also want to talk to the student to provide a learning opportunity.

A rubric is a defined set of rules to convert open-response items like essays into usable quantitative data, such as scoring the essay 0 to 4 points.

How many rubrics do I need?

In some cases, a single rubric will suffice.  This is typical in mathematics, where the goal is a single correct answer.  In writing, the goal is often more complex.  You might be assessing writing and argumentative ability at the same time you are assessing language skills.  For example, you might have rubrics for spelling, grammar, paragraph structure, and argument structure – all on the same essay.

Examples

Spelling rubric for an essay

Points Description
0 Essay contains 5 or more spelling mistakes
1 Essay contains 1 to 4 spelling mistakes
2 Essay does not contain any spelling mistakes


Argument rubric for an essay

“Your school is considering the elimination of organized sports.  Write an essay to provide to the School Board that provides 3 reasons to keep sports, with a supporting explanation for each.”

Points Description
0 Student does not include any reasons with explanation (includes providing 3 reasons but no explanations)
1 Student provides 1 reason with a clear explanation
2 Student provides 2 reasons with clear explanations
3 Student provides 3 reasons with clear explanations


Answer rubric for math

Points Description
0 Student provides no response or a response that does not indicate understanding of the problem.
1 Student provides a response that indicates understanding of the problem, but does not arrive at correct answer OR provides the correct answer but no supporting work.
2 Student provides a response with the correct answer and supporting work that explains the process.


How do I score tests with a rubric?

Well, the traditional approach is to just take the integers supplied by the rubric and add them to the number-correct score. This is consistent with classical test theory, and therefore fits with conventional statistics such as coefficient alpha for reliability and Pearson correlation for discrimination. However, the modern paradigm of assessment is item response theory, which analyzes the rubric data much more deeply and applies advanced mathematical modeling like the generalized partial credit model (Muraki, 1992; resources on that here and here).

An example of this is below.  Imagine that you have an essay which is scored 0-4 points.  This graph shows the probability of earning each point level, as a function of total score (Theta).  Someone who is average (Theta=0.0) is likely to get 2 points, the yellow line.  Someone at Theta=1.0 is likely to get 3 points.  Note that the middle curves are always bell-shaped while the ones on the end go up to an upper asymptote of 1.0.  That is, the smarter the student, the more likely they are to get 4 out of 4 points, but the probability of that can never go above 100%, obviously.

Generalized-partial-credit-model

How can I efficiently implement a scoring rubric?

It is much easier to implement a scoring rubric if your online assessment platform supports them in an online marking module, especially if the platform already has integrated psychometrics like the generalized partial credit model.  Below is an example of what an online essay marking system would look like, allowing you to efficiently implement rubrics.  It should have advanced functionality, such as allowing multiple rubrics per item, multiple raters per response, anonymity, and more.

Online marking essays


What about automated essay scoring?

You also have the option of using automated essay scoring; once you have some data from human raters on rubrics, you can train machine learning models to help.  Unfortunately, the world is not yet to the state where we have a droid that you can just feed a pile of student papers to grade!


student cheating on test

Test security is an increasingly important topic. There are several causes, including globalization, technological enhancements, and the move to a gig-based economy driven by credentials. Any organization that sponsors assessments that have any stakes tied to them must be concerned with security, as the greater the stakes, the greater the incentive to cheat. And threats to test security are also threats to validity, and therefore the entire existence of the assessment.

The core of this protection is a test security plan, which will be discussed elsewhere. The first phase is an evaluation of your current situation. I will present a suggested model for that here. There are five steps in this model.

1. Identify threats to test security that are relevant to your program.

2. Evaluate the possible frequency and impact of each threat.

3. Determine relevant deterrents or preventative measures for each threat.

4. Identify data forensics that might detect issues.

5. Have a plan for how to deal with issues, like a candidate found cheating.

OK, Explain These Five Steps More Deeply

1. Identify threats to test security that are relevant to your program.

threats-to-test-security

Some of the most commonly encountered threats are listed below. Determine which ones might be relevant to your program, and brainstorm additional threats if necessary. If your organization has multiple programs, this list can differ between them.

-Brain dump makers (content theft)

-Brain dump takers (preknowledge)

-Examinee copying/collusion

-Outside help at an individual level (e.g., parent or friend via wireless audio)

-Outside help at a group level (e.g., teacher providing answers to class)

2. Evaluate the possible frequency and impact of each threat.

Create a table with three columns. The first is the list of threats and the latter two are Frequency, and Impact, where you can rate them, such as on a scale of 1 to 5. See examples below. Again, if your organization has multiple assessments, this can vary substantially amongst them. Brain dumps might be a big problem for one program but not another. I recommend multiplying or summing the values into a common index, which you might call criticality.

3. Determine relevant proactive measures for each threat.

Start with the most critical threats. Brainstorm policies or actions that could either deter that threat, mitigate its effects, or prevent it outright. Consider a cost/benefit analysis for implementing each. Determine which you would like to put in place, in a prioritized manner.

4. Identify data forensics that might detect issues.

The adage of “An ounce of prevention is worth a pound of cure” is cliché in the field of test security, so it is certainly worth minding. But there will definitely be test security threats which will impact you no matter how many proactive measures you put into place. In such cases, you also need to consider which data forensic methods you might use to look for evidence of those threats occurring. There are wide range of such analyses – here is a blog post that talks about some.

5. Have a plan for how to deal with issues, like a candidate found cheating.

This is an essential component of the test security plan. What will you do if you find strong evidence of students coping off each other, or candidates using a brain dump site?

Note how this methodology is similar to job analysis, which rates job tasks or KSAs on their frequency and criticality/importance, and typically multiplies those values and then ranks or sorts the tasks based on the total value. This is a respected methodology for studying the nature of work, so much so that it is required to be the basis of developing a professional certification exam, in order to achieve accreditation. More information is available here.

What can I do about these threats to test security?

There are four things you can do to address threats to test security, as was implicitly described above:

1. Prevent – In some situations, you might be able to put measures in place that fully prevent the issue from occurring. Losing paper exam booklets? Move online. Parents yelling answers in the window? Hold the test in a location with no parents allowed.

2. Deter – In most cases, you will not be able to prevent the threat outright, but you can deter it. Deterrents can be up front or after the fact. An upfront deterrent would be a proctor present during the exam. An after-the-fact deterrent would be the threat of a ban from practicing in a profession if you are caught cheating.

3. Detect – You can’t control all aspects of delivery. Fortunately, there are a wide range of data forensic approaches you can use to detect anomalies. This are not necessarily limited to test security though; low item response times could be indicative of preknowledge or simply of a student that doesn’t care.

4. Mitigate – Put procedures into place that reduce the effect of the threat.  Examinees stealing your items?  You can frequently rotate test forms.  Examinees might still steal but at least items are only out for 3 months instead of 5 years, for example.

The first two pieces are essential components of standardized testing. The standardized in that phrase does not refer to educational standards, but rather to the fact that we are making the interaction of person with test as uniform as possible, as we want to remove as many outside variables as possible that could potentially affect test scores.

Examples

This first example is for an international certification.  Such exams are very high stakes and therefore require many levels of security.

Test Risk (1-5) Notes Result
Content theft 5 Huge risk of theft; expensive to republish Need all the help we can get.  Thieves can make real money by stealing our content.  We will have in-person proctoring in high-security centers, and also use a lockdown browser.  All data will be analyzed with SIFT.
Pre-knowledge 5 Lots of brain dump sites We definitely need safeguards to deter use of brain dump sites.  We search the web to find sites and issue DMCA takedown notices.  We analyze all candidate data to compare to brain dumps.  Use Trojan Horse items.
Proxy testers 3 Our test is too esoteric We need basic procedures in place to ensure identity, but will not spend big bucks on things like biometrics.
Proctor influence 3 Proctors couldn’t help much but they could steal content Ensure that all proctors are vetted by a third party such as our delivery vendor.

Now, let’s assume that the same organization also delivers a practice exam for this certification, which obviously has much lower security.

Test Risk (1-5) Notes Result
Content theft 2 You don’t want someone to steal the items and sell them, but it is not as big a deal as the Cert; cheap to republish Need some deterrence but in-person proctoring is not worth the investment.  Let’s use a lockdown browser.
Pre-knowledge 1 No reason to do this; actually hurts candidate No measures
Proxy testers 1 Why would you pay someone else to take your practice test? Actually hurts candidate. No measures
Proctor influence 1 N/A  No measures

It’s an arms race!

Because test security is an ongoing arms race, you will need to periodically re-evaluate using this methodology, just like certifications are required to re-perform a job analysis study every few years because professions can change over time.  New threats may present themselves while older ones fall by the wayside.

Of course, the approach discussed here is not a panacea, but it is certainly better than haphazardly putting measures in place.  One of my favorite quotes is “If you aim at nothing, that’s exactly what you will hit.”  If you have some goal and plan in mind, you have a much greater chance of success in minimizing threats to test security than if your organization simply puts the same measures in place for all programs without comparison or evaluation.

Interested in test security as a more general topic?  Attend the Conference on Test Security.

Item banking refers to the purposeful creation of a database of assessment items to serve as a central repository of all test content, improving efficiency and quality. The term item refers to what many call questions; though their content need not be restricted as such and can include problems to solve or situations to evaluate in addition to straightforward questions. As a critical foundation to the test development cycle, item banking is the foundation for the development of valid, reliable content and defensible test forms.

Automated item banking systems, such as Assess.ai or FastTest, result in significantly reduced administrative time for developing/reviewing items and assembling/publishing tests, while producing exams that have greater reliability and validity.  Contact us to request a free account.


What is Item Banking?

While there are no absolute standards in creating and managing item banks, best practice guidelines are emerging. Here are the essentials your should be looking for:

   Items are reusable objects; when selecting an item banking platform it is important to ensure that items can be used more than once; ideally, item performance should be tracked not only within a test form but across test forms as well.

   Item history and usage are tracked; the usage of a given item, whether it is actively on a test form or dormant waiting to be assigned, should be easily accessible for test developers to assess, as the over-exposure of items can reduce the validity of a test form. As you deliver your items, their content is exposed to examinees. Upon exposure to many examinees, items can then be flagged for retirement or revision to reduce cheating or teaching to the test.

   Items can be sorted; as test developers select items for a test form, it is imperative that they can sort items based on their content area or other categorization methods, so as to select a sample of items that is representative of the full breadth of constructs we intend to measure.

   Item versions are tracked; as items appear on test forms, their content may be revised for clarity. Any such changes should be tracked and versions of the same item should have some link between them so that we can easily review the performance of earlier versions in conjunction with current versions.

   Review process workflow is tracked; as items are revised and versioned, it is imperative that the changes in content and the users who made these changes are tracked. In post-test assessment, there may be a need for further clarification, and the ability to pinpoint who took part in reviewing an item and expedite that process.

   Metadata is recorded; any relevant information about an item should be recorded and stored with the item. The most common applications for metadata that we see are author, source, description, content area, depth of knowledge, IRT parameters, and CTT statistics, but there are likely many data points specific to your organization that is worth storing.

Managing an Item Bank

Names are important. As you create or import your item banks it is important to identify each item with a unique, but recognizable name. Naming conventions should reflect your bank’s structure and should include numbers with leading zeros to support true numerical sorting.  You might want to also add additional pieces of information.  If importing, the system should be smart enough to recognize duplicates.

Search and filter. The system should also have a reliable sorting mechanism. 

automated item generation cpr

Prepare for the Future: Store Extensive Metadata

Metadata is valuable. As you create items, take the time to record simple metadata like author and source. Having this information can prove very useful once the original item writer has moved to another department, or left the organization. Later in your test development life cycle, as you deliver items, you have the ability to aggregate and record item statistics. Values like discrimination and difficulty are fundamental to creating better tests, driving reliability, and validity.

Statistics are used in the assembly of test forms while classical statistics can be used to estimate mean, standard deviation, reliability, standard error, and pass rate. 

Item banking statistics

Item response theory parameters can come in handy when calculating test information and standard error functions. Data from both psychometric theories can be used to pre-equate multiple forms.

In the event that your organization decides to publish an adaptive test, utilizing CAT delivery, item parameters for each item will be essential. This is because they are used for intelligent selection of items and scoring examinees. Additionally, in the event that the integrity of your test or scoring mechanism is ever challenged, documentation of validity is essential to defensibility and the storage of metadata is one such vital piece of documentation.

Increase Content Quality: Track Workflow

Utilize a review workflow to increase quality. Using a standardized review process will ensure that all items are vetted in a similar matter. Have a step in the process for grammar, spelling, and syntax review, as well as content review by a subject matter expert. As an item progresses through the workflow, its development should be tracked, as workflow results also serve as validity documentation.

Accept comments and suggestions from a variety of sources. It is not uncommon for each item reviewer to view an item through their distinctive lens. Having a diverse group of item reviewers stands to benefit your test-takers, as they are likely to be diverse as well!

item review kanban

Keep Your Items Organized: Categorize Them

Identify items by content area. Creating a content hierarchy can also help you to organize your item bank and ensure that your test covers the relevant topics. Most often, we see content areas defined first by an analysis of the construct(s) being tested. In the event of a high school science test, this may include the evaluation of the content taught in class. A high-stakes certification exam, almost always includes a job-task analysis. Both methods produce what is called a test blueprint, indicating how important various content areas are to the demonstration of knowledge in the areas being assessed.

Once content areas are defined, we can assign items to levels or categories based on their content. As you are developing your test, and invariably referring back to your test blueprint, you can use this categorization to determine which items from each content area to select.

Why Item Banking?

There is no doubt that item banking is a key aspect of developing and maintaining quality assessments. Utilizing best practices, and caring for your items throughout the test development life cycle, will pay great dividends as it increases the reliability, validity, and defensibility of your assessment. Moreover, good item banking will make the job easier and more efficient thus reducing the cost of item development and test publishing.

Ready to improve assessment quality through item banking?

Visit our Contact Us page, where you can request a demonstration or a free account (up to 500 items).

psychometrics-possibilities

Today I read an article in The Industrial-Organizational Psychologist (the colloquial journal published by the Society for Industrial Organizational Psychology) that really resonated with me.

Has Industrial-Organizational Psychology Lost Its Way?
-Deniz S. Ones, Robert B. Kaiser, Tomas Chamorro-Premuzic, Cicek Svensson

Why?  Because I think a lot of the points they are making are also true about the field of Psychometrics and our innovation.  They summarize their point in six bullet points that they suggest present a troubling direction for their field.  Though honestly, I suppose a lot of Academia falls under these, while some great innovation is happening over on some free MOOCs and the like because they aren’t fettered by the chains of the purely or partially academic world.

  • an overemphasis on theory
  • a proliferation of, and fixation on, trivial methodological minutiae
  • a suppression of exploration and a repression of innovation
  • an unhealthy obsession with publication while ignoring practical issues
  • a tendency to be distracted by fads
  • a growing habit of losing real-world influence to other fields.

So what is psychometrics supposed to be doing?

The part that has irked me the most about Psychometrics over the years is the overemphasis on theory and minutiae rather than solving practical problems.  This is the main reason I stopped attending the NCME conference and instead attend practical conferences like ATP.  It stems from my desire to improve the quality of assessment throughout the world.  Development of esoteric DIF methodology, new multidimensional IRT models, or a new CAT sub-algorithm when there are already dozens and the new one offers a 0.5% increase in efficiency… stuff like that isn’t going to impact all the terrible assessment being done in the world and the terrible decisions being made about people based on those assessments.  Don’t get me wrong, there is a place for the substantive research, but I feel the latter point is underserved.

The Goal: Quality Assessment

psychometrician in code

And it’s that point that is driving the work that I do.  There is a lot of mediocre or downright bad assessment out there in the world.  I once talked to a Pre-Employment testing company and asked if I could help implement strong psychometrics to improve their tests as well as validity documentation.  Their answer?  It was essentially “No thanks, we’ve never been sued so we’re OK where we are.”  Thankfully, they fell in the mediocre category rather the downright bad category.

Of course, in many cases, there is simply a lack of incentive to produce quality assessment.  Higher Education is a classic case of this.  Professional schools (e.g., Medicine) often have accreditation tied in some part to demonstrating quality assessment of their students.  There is typically no such constraint on undergraduate education, so your Intro to Psychology and freshman English Comp classes still do assessment the same way they did 40 years ago… with no psychometrics whatsoever.  Many small credentialing organizations lack incentive too, until they decide to pursue accreditation.

I like to describe the situation this way: take all the assessments of the world and get them a percentile rank in psychometric quality.  The top 5% are the big organizations, such as Nursing licensure in the US, that have in-house psychometricians, large volumes, and huge budgets.  We don’t have to worry about them as they will be doing good assessment (and that substantive research I mentioned might be of use to them!).  The bottom 50% or more are like university classroom assessments.  They’ll probably never use real psychometrics.  I’m concerned about that 50-95th percentile.

Example: Credentialing

A great example of this level is the world of Credentialing.  There a TON of poorly constructed licensure and certification tests that are being used to make incredibly important decisions about people’s lives.  Some are simply because the organization is for-profit and doesn’t care.  Some are caused by external constraints.  I once worked with a Department of Agriculture for a western US State, where the legislature mandated that licensure tests be given for certain professions, even though only like 3 people per year took some tests.

So how do we get groups like that to follow best practices in assessment?  In the past, the only way to get psychometrics done is for them to pay a consultant a ton of money that they don’t have.  Why spend $5k on an Angoff study or classical test report for 3 people/year?  I don’t blame them.  The field of Psychometrics needs to find a way to help such groups.  Otherwise, the tests are low quality and they are giving licenses to unqualified practitioners.

There are some bogus providers out there, for sure.  I’ve seen Certification delivery platforms that don’t even store the examinee responses, which would be necessary to do any psychometric analysis whatsoever.  Obviously they aren’t doing much to help the situation.  Software platforms that focus on things like tracking payments and prerequisites simply miss the boat too.  They are condoning bad assessment.

Similarly, mathematically complex advancements such as multidimensional IRT are of no use to this type of organization.  It’s not helping the situation.

An Opportunity for Innovation

making-predictions-and-decisions-based-on-test-scores

I think there is still a decent amount of innovation in our field.  There are organizations that are doing great work to develop innovative items, psychometrics, and assessments.  However, it is well known that large corporations will snap up fresh PhDs in Psychometrics and then lock them in a back room to do uninnovative work like run SAS scripts or conduct Angoff studies over and over and over.  This happened to me and after only 18 months I was ready for more.

Unfortunately, I have found that a lot of innovation is not driven by producing good measurement.  I was in a discussion on LinkedIn where someone was pushing gamification for assessments and declared that measurement precision was of no interest.  This, of course, is ludicrous.  It’s OK to produce random numbers as long as the UI looks cool for students?

Innovation in Psychometrics at ASC

Much of the innovation at ASC is targeted towards the issue I have presented here.  I originally developed Iteman 4 and Xcalibre 4 to meet this type of usage.  I wanted to enable an organization to produce professional psychometric analysis reports on their assessments without having to pay massive amounts of money to a consultant.  Additionally, I wanted to save time; there are other software programs which can produce similar results, but drop them in text files or Excel spreadsheets instead of Microsoft Word which is of course what everyone would use to draft a report.

Much of our FastTest platform is designed with a similar bent.  Tired of running an Angoff study with items on a projector and the SMEs writing all their ratings with pencil and paper, only to be transcribed later?  Well, you can do this online.  Moreover, because it is only you can use the SMEs remotely rather than paying to fly them into a central office.  Want to publish an adaptive (CAT) exam without writing code?  We have it built directly into our test publishing interface.

Back to My Original Point

So the title is “What is Psychometrics Supposed to be Doing?” with regards to psychometrics innovation.  My answer, of course, is improving assessment.  The issue I take with the mathematically advanced research is that it is only relevant for that top 5% of organizations that is mentioned.  It’s also our duty as psychometricians to find better ways to help the other 95%.

What else can we be doing?  I think the future here is automation.  Iteman 4 and Xcalibre 4, as well as FastTest, were really machine learning and automation platforms before those things became so en vogue.  As the SIOP article mentioned at the beginning talks about, other scholarly areas like Big Data are gaining more real-world influence even if they are doing things that Psychometrics has done for a long time.  Item Response Theory is a form of machine learning and it’s been around for 50 years!


modified-Angoff Beuk compromise

A modified-Angoff method study is one of the most common ways to set a defensible cutscore on an exam.  It therefore means that the pass/fail decisions made by the test are more trustworthy than if you picked a random number; if your doctor, lawyer, accountant, or other professional has passed an exam where the cutscore has been set with this method, you can place more trust in their skills.

What is the Angoff method?

It is a scientific way of setting a cutscore (pass point) on a test.  If you have a criterion-referenced interpretation, it is not legally defensible to just conveniently pick a round number like 70%; you need a formal process.  There are a number of acceptable methodologies in the psychometric literature for standard-setting studies, also known as cutscores or passing points.  Some examples include Angoff, modified-Angoff, Bookmark, Contrasting Groups, and Borderline.  The modified-Angoff approach is by far the popular approach.  It is used especially frequently for certification, licensure, certificate, and other credentialing exams. 

It was originally suggested as a mere footnote by renowned researcher William Angoff, at Educational Testing Service.

How does the Angoff approach work?

First, you gather a group of subject matter experts, and have them define what they consider to be a Minimally Competent Candidate (MCC).  Next, you have them estimate the percent of minimally competent candidates that will answer each item correctly.  You then analyze the results for outliers or inconsistencies, and have the experts discuss then re-rate the items to gain better consensus.  The average final rating is then the expected percent-correct score for a minimally competent candidate.

Advantages of the Angoff method

  1. It is defensible.  Because it is the most commonly used approach and is widely studied in the scientific literature, it is well-accepted.
  2. You can implement it before a test is ever delivered.  Some other methods require you to deliver the test to a large sample first.
  3. It is conceptually simple, easy enough to explain to non-psychometricians.
  4. It incorporates the judgment of a panel of experts, not just one person or a round number.
  5. It works for tests with both classical test theory and item response theory.
  6. It does not take long to implement – if a short test, it can be done in a matter of hours!
  7. It can be used with different item types, including polytomously scored items (multi-points).

Disadvantages of the Angoff method

  1. It does not use actual data, unless you implement the Beuk method alongside.  
  2. It can lead to the experts overestimating the performance of entry-level candidates, as they forgot what it was like to start out 20-30 years ago.

FAQ about the Angoff approach

How do I calculate the Angoff cutscore and inter-rater reliability?

What is the difference between Angoff and modified-Angoff?

The original approach had the experts only say whether they thought an MCC would get it right, not the percentage.

Why do I need to do an Angoff study?

If the test is used to make decisions, like hiring or certification, you are not allowed to pick a round number like 70% with no justification.

What if the experts disagree?

You will need to evaluate inter-rater reliability and agreement, then re-rate the items. More info below.

How many experts do I need?

The bare minimum is 6; 8-10 is better.

Do I need to deliver the test first?

No, that is one advantage of this method - you can set a cutscore before you deliver to any examinees.


Example of the Modified-Angoff Method

First of all, do not expect a straightforward, easy process that leads to an unassailably correct cutscore.  All standard-setting methods involve some degree of subjectivity.  The goal of the methods is to reduce that subjectivity as much as possible.  Some methods focus on content, others on examinee performance data, while some try to meld the two.

Step 1: Prepare Your Team

The modified-Angoff process depends on a representative sample of subject matter experts (SMEs), usually 6-20. By “representative” I mean they should represent the various stakeholders. For instance, a certification for medical assistants might include experienced medical assistants, nurses, and physicians, from different areas of the country. You must train them about their role and how the process works, so they can understand the end goal and drive toward it.

Step 2: Define The Minimally Competent Candidate (MCC)

This concept is the core of the modified-Angoff method, though it is known by a range of terms or acronyms, including minimally qualified candidates (MQC) or just barely qualified (JBQ).  The reasoning is that we want our exam to separate candidates that are qualified from those that are not.  So we ask the SMEs to define what makes someone qualified (or unqualified!) from a perspective of skills and knowledge. This leads to a conceptual definition of an MCC. We then want to estimate what score this borderline candidate would achieve, which is the goal of the remainder of the study. This step can be conducted in person, or via webinar.

Step 3: Round 1 Ratings

Next, ask your SMEs to read through all the items on your test form and estimate the percentage of MCCs that would answer each correctly.  A rating of 100 means the item is a slam dunk; it is so easy that every MCC would get it right.  A rating of 40 is very difficult.  Most ratings are in the 60-90 range if the items are well-developed. The ratings should be gathered independently; if everyone is in the same room, let them work on their own in silence. This can easily be conducted remotely, though.

Step 4: Discussion

This is where it gets fun.  Identify items where there is the most disagreement (as defined by grouped frequency distributions or standard deviation) and make the SMEs discuss it.  Maybe two SMEs thought it was super easy and gave it a 95 and two other SMEs thought it was super hard and gave it a 45.  They will try to convince the other side of their folly. Chances are that there will be no shortage of opinions and you, as the facilitator, will find your greatest challenge is keeping the meeting on track. This step can be conducted in person, or via webinar.

Step 5: Round 2 Ratings

Raters then re-rate the items based on the discussion.  The goal is that there will be a greater consensus.  In the previous example, it’s not likely that every rater will settle on a 70.  But if your raters all end up from 60-80, that’s OK. How do you know there is enough consensus?  We recommend the inter-rater reliability suggested by Shrout and Fleiss (1979), as well as looking at inter-rater agreement and dispersion of ratings for each item. This use of multiple rounds is known as the Delphi approach; it pertains to all consensus-driven discussions in any field, not just psychometrics.

Step 6: Evaluate Results and Final Recommendation

Evaluate the results from Round 2 as well as Round 1.  An example of this is below.  What is the recommended cutscore, which is the average or sum of the Angoff ratings depending on the scale you prefer?  Did the reliability improve?  Estimate the mean and SD of examinee scores (there are several methods for this). What sort of pass rate do you expect?  Even better, utilize the Beuk Compromise as a “reality check” between the modified-Angoff approach and actual test data.  You should take multiple points of view into account, and the SMEs need to vote on a final recommendation. They, of course, know the material and the candidates so they have the final say.  This means that standard setting is a political process; again, reduce that effect as much as you can.

Some organizations do not set the cutscore at the recommended point, but at one standard error of judgment (SEJ) below the recommended point.  The SEJ is based on the inter-rater reliability; note that it is NOT the standard error of the mean or the standard error of measurement.  Some organizations use the latter; the former is just plain wrong (though I have seen it used by amateurs).


modified angoff

Step 7: Write Up Your Report

Validity refers to evidence gathered to support test score interpretations.  Well, you have lots of relevant evidence here. Document it.  If your test gets challenged, you’ll have all this in place.  On the other hand, if you just picked 70% as your cutscore because it was a nice round number, you could be in trouble.

Additional Topics

In some situations, there are more issues to worry about.  Multiple forms?  You’ll need to equate in some way.  Using item response theory?  You’ll have to convert the cutscore from the modified-Angoff method onto the theta metric using the Test Response Function (TRF).  New credential and no data available? That’s a real chicken-and-egg problem there.

Where Do I Go From Here?

Ready to take the next step and actually apply the modified-Angoff process to improving your exams?  Sign up for a free account in our  FastTest item banker.  

References

Shrout, P. E., & Fleiss, J. L. (1979). Intraclass correlations: uses in assessing rater reliability. Psychological bulletin86(2), 420.

test-scaling

I often hear this question about scaling, especially regarding the scaled scoring functionality found in software like FastTest and Xcalibre.  The following is adapted from lecture notes I wrote while teaching a course in Measurement and Assessment at the University of Cincinnati.

Test Scaling: Sort of a Tale of Two Cities

Scaling at the test level really has two meanings in psychometrics. First, it involves defining the method to operationally scoring the test, establishing an underlying scale on which people are being measured.  It also refers to score conversions used for reporting scores, especially conversions that are designed to carry specific information.  The latter is typically called scaled scoring.

You have all been exposed to this type of scaling, though you might not have realized it at the time. Most high-stakes tests like the ACT, SAT, GRE, and MCAT are reported on scales that are selected to convey certain information, with the actual numbers selected more or less arbitrarily. The SAT and GRE have historically had a nominal mean of 500 and a standard deviation of 100, while the ACT has a nominal mean of 18 and standard deviation of 6. These are actually the same scale, because they are nothing more than a converted z-score (standard or zed score), simply because no examinee wants to receive a score report that says you got a score of -1. The numbers above were arbitrarily selected, and then the score range bounds were selected based on the fact that 99% of the population is within plus or minus three standard deviations. Hence, the SAT and GRE range from 200 to 800 and the ACT ranges from 0 to 36. This leads to the urban legend of receiving 200 points for writing your name correctly on the SAT; again, it feels better for the examinee. A score of 300 might seem like a big number and 100 points above the minimum, but it just means that someone is in the 3rd percentile.

Now, notice that I said “nominal.” I said that because the tests do not actually have those means observed in samples, because the samples have substantial range restriction. Because these tests are only taken by students serious about proceeding to the next level of education, the actual sample is of higher ability than the population. The lower third or so of high school students usually do not bother with the SAT or ACT. So many states will have an observed average ACT of 21 and standard deviation of 4. This is an important issue to consider in developing any test. Consider just how restricted the population of medical school students is; it is a very select group.

How can I select a score scale?

score-scale

For various reasons, actual observed scores from tests are often not reported, and only converted scores are reported.  If there are multiple forms which are being equated, scaling will hide the fact that the forms differ in difficulty, and in many cases, differ in cutscore.  Scaled scores can facilitate feedback.  They can also help the organization avoid explanations of IRT scoring, which can be a headache to some.

When deciding on the conversion calculations, there are several important questions to consider.

First, do we want to be able to make fine distinctions among examinees? If so, the range should be sufficiently wide. My personal view is that the scale should be at least as wide as the number of items; otherwise you are voluntarily giving up information. This in turn means you are giving up variance, which makes it more difficult to correlate your scaled scores with other variables, like the MCAT is correlated with success in medical school. This, of course, means that you are hampering future research – unless that research is able to revert back to actual observed scores to make sure all information possible is used. For example, supposed a test with 100 items is reported on a 5-point grade scale of A-B-C-D-F. That scale is quite restricted, and therefore difficult to correlate with other variables in research. But you have the option of reporting the grades to students and still using the original scores (0 to 100) for your research.

Along the same lines, we can swing completely in the other direction. For many tests, the purpose of the test is not to make fine distinctions, but only to broadly categorize examinees. The most common example of this is a mastery test, where the examinee is being assessed on their mastery of a certain subject, and the only possible scores are pass and fail. Licensure and certification examinations are an example. An extension of this is the “proficiency categories” used in K-12 testing, where students are classified into four groups: Below Basic, Basic, Proficient, and Advanced. This is used in the National Assessment of Educational Progress. Again, we see the care taken for reporting of low scores; instead of receiving a classification like “nonmastery” or “fail,” the failures are given the more palatable “Below Basic.”

Another issue to consider, which is very important in some settings but irrelevant in others, is vertical scaling. This refers to the chaining of scales across various tests that are at quite different levels. In education, this might involve linking the scales of exams in 8th grade, 10th grade, and 12th grade (graduation), so that student progress can be accurately tracked over time. Obviously, this is of great use in educational research, such as the medical school process. But for a test to award a certification in a medical specialty, it is not relevant because it is really a one-time deal.

Lastly, there are three calculation options: pure linear (ScaledScore = RawScore * Slope + Intercept), standardized conversion (Old Mean/SD to New Mean/SD), and nonlinear approaches like Equipercentile.

Perhaps the most important issue is whether the scores from the test will be criterion-referenced or norm-referenced. Often, this choice will be made for you because it distinctly represents the purpose of your tests. However, it is quite important and usually misunderstood, so I will discuss this in detail.

Criterion-Referenced vs. Norm-Referenced

data-analysis-norms

This is a distinction between the ways test scores are used or interpreted. A criterion-referenced score interpretation means that the score is interpreted with regards to defined content, blueprint, or curriculum (the criterion), and ignores how other examinees perform (Bond, 1996). A classroom assessment is the most common example; students are scored on the percent of items correct, which is taken to imply the percent of the content they have mastered. Conversely, a norm-referenced score interpretation is one where the score provides information about the examinee’s standing in the population, but no absolute (or ostensibly absolute) information regarding their mastery of content. This is often the case with non-educational measurements like personality or psychopathology. There is no defined content which we can use as a basis for some sort of absolute interpretation. Instead, scores are often either z-scores or some linear function of z-scores.  IQ is historically scaled with a mean of 100 and standard deviation of 15.

It is important to note that this dichotomy is not a characteristic of the test, but of the test score interpretations. This fact is more apparent when you consider that a single test or test score can have several interpretations, some of which are criterion-referenced and some of which are norm-referenced. We will discuss this deeper when we reach the topic of validity, but consider the following example. A high school graduation exam is designed to be a comprehensive summative assessment of a secondary education. It is therefore specifically designed to cover the curriculum used in schools, and scores are interpreted within that criterion-referenced context. Yet scores from this test could also be used for making acceptance decisions at universities, where scores are only interpreted with respect to their percentile (e.g., accept the top 40%). The scores might even do a fairly decent job at this norm-referenced application. However, this is not what they are designed for, and such score interpretations should be made with caution.

Another important note is the definition of “criterion.” Because most tests with criterion-referenced scores are educational and involve a cutscore, a common misunderstanding is that the cutscore is the criterion. It is still the underlying content or curriculum that is the criterion, because we can have this type of score interpretation without a cutscore. Regardless of whether there is a cutscore for pass/fail, a score on a classroom assessment is still interpreted with regards to mastery of the content.  To further add to the confusion, Industrial/Organizational psychology refers to outcome variables as the criterion; for a pre-employment test, the criterion is typically Job Performance at a later time.

This dichotomy also leads to some interesting thoughts about the nature of your construct. If you have a criterion-referenced score, you are assuming that the construct is concrete enough that anybody can make interpretations regarding it, such as mastering a certain percentage of content. This is why non-concrete constructs like personality tend to be only norm-referenced. There is no agreed-upon blueprint of personality.

Multidimensional Scaling

camera lenses for multidimensional item response theory

An advanced topic worth mentioning is multidimensional scaling (see Davison, 1998). The purpose of multidimensional scaling is similar to factor analysis (a later discussion!) in that it is designed to evaluate the underlying structure of constructs and how they are represented in items. This is therefore useful if you are working with constructs that are brand new, so that little is known about them, and you think they might be multidimensional. This is a pretty small percentage of the tests out there in the world; I encountered the topic in my first year of graduate school – only because I was in a Psychological Scaling course – and have not encountered it since.

Summary of test scaling

Scaling is the process of defining the scale that on which your measurements will take place. It raises fundamental questions about the nature of the construct. Fortunately, in many cases we are dealing with a simple construct that has a well-defined content, like an anatomy course for first-year medical students. Because it is so well-defined, we often take criterion-referenced score interpretations at face value. But as constructs become more complex, like job performance of a first-year resident, it becomes harder to define the scale, and we start to deal more in relatives than absolutes. At the other end of the spectrum are completely ephemeral constructs where researchers still can’t agree on the nature of the construct and we are pretty much limited to z-scores. Intelligence is a good example of this.

Some sources attempt to delineate the scaling of people and items or stimuli as separate things, but this is really impossible as they are so confounded. Especially since people define item statistics (the percent of people that get an item correct) and items define people scores (the percent of items a person gets correct). It is for this reason that IRT, the most advanced paradigm in measurement theory, was designed to place items and people on the same scale. It is also for this reason that item writing should consider how they are going to be scored and therefore lead to person scores. But because we start writing items long before the test is administered, and the nature of the construct is caught up in the scale, the issues presented here need to be addressed at the very beginning of the test development cycle.

test response functions

Item response theory (IRT) is a family of machine learning models in the field of psychometrics, which are used to design, analyze, validate, and score assessments.  It is a very powerful psychometric paradigm that allows researchers to build stronger assessments, whether they work in Education, Psychology, Human Resources, or other fields.  It also solves measurement problems like equating across years, or creating vertical scales.

Want to learn more about IRT, how it works, and why it is so important for assessment?  Read on.

What is Item Response Theory?

IRT is a family of models that try to describe how examinees respond to items on a test, hence the name.  These models can be used to evaluate item performance, because the descriptions are quite useful in and of themselves.  However, item response theory ended up doing so much more.

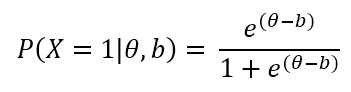
IRT is model-driven, in that there is a specific mathematical equation that is assumed.  There are different parameters (a, b, c) that shape this equation to different needs.  That’s what defines different IRT models.  This will be discussed at length below.

The models put people and items onto a latent scale, which is usually called θ (theta).  This represents whatever is being measured, whether IQ, anxiety, or knowledge of accounting laws in Croatia.  IRT helps us understand the nature of the scale, how a person answers each question, the distribution of item difficulty, and much more.  IRT used to be known as latent trait theory and item characteristic curve theory.

IRT requires specially-designed software.  Click the link below to download our software  Xcalibre, which provides a user-friendly and visual platform for implementing IRT.


IRT analysis with Xcalibre


Why do we need item response theory?

IRT represents an important innovation in the field of psychometrics. While now more than 50 years old – assuming the “birth” is the classic Lord and Novick (1969) text – it is still underutilized and remains a mystery to many practitioners.

Item response theory is more than just a way of analyzing exam data, it is a paradigm to drive the entire lifecycle of designing, building, delivering, scoring, and analyzing assessments.

  • IRT helps us determine if a test is providing accurate scores on people, much more so than classical test theory.
  • IRT helps us provide better feedback to examinees, which has far-reaching benefits for education and workforce development.
  • IRT reduces bias in the instrument, through advanced techniques like differential item functioning.
  • IRT maintains meaningful scores across time, known as equating.
  • IRT can connect multiple levels of content, such as Math curriculum from Grades 3 to 12 if that is what you want to measure, known as vertical scaling.
  • IRT is necessary to implement adaptive testing.

Item response theory requires larger sample sizes and is much more complex than its predecessor, classical test theory, but is also far more powerful.  IRT requires quite a lot of expertise, typically a PhD.  So it is not used for small assessments like a final exam at universities, but is used for almost all major assessments in the world.

The Driver: Problems with Classical Test Theory

Classical test theory (CTT) is approximately 100 years old, and still remains commonly used because it is appropriate for certain situations, and it is simple enough that it can be used by many people without formal training in psychometrics.  Most statistics are limited to means, proportions, and correlations.  However, its simplicity means that it lacks the sophistication to deal with a number of very important measurement problems.  Here are just a few.

  • Sample dependency: Classical statistics are all sample dependent, and unusable on a different sample; results from IRT are sample-independent within a linear transformation (that is, two samples of different ability levels can be easily converted onto the same scale).
  • Test dependency: Classical statistics are tied to a specific test form, and do not deal well with sparse matrices introduced by multiple forms, linear on the fly testing, or adaptive testing.
  • Weak linking/equating: CTT has a number of methods for linking multiple forms, but they are weak compared to IRT.
  • Measuring the range of students: Classical tests are built for the average student, and do not measure high or low students very well; conversely, statistics for very difficult or easy items are suspect.
  • CTT cannot do vertical scaling.
  • Lack of accounting for guessing: CTT does not account for guessing on multiple choice exams.
  • Scoring: Scoring in classical test theory does not take into account item difficulty.
  • Adaptive testing: CTT does not support adaptive testing in most cases.

Learn more about the differences between CTT and IRT here.

Item Response Theory Parameters

The foundation of IRT is a mathematical model defined by item parametersA parameter is an aspect of a mathematical model that can change its shape or other aspects.  For dichotomous items (those scored correct/incorrect), each item has three parameters:


   a: the discrimination parameter, an index of how well the item differentiates low from top examinees; typically ranges from 0 to 2, where higher is better, though not many items are above 1.0.

   b: the difficulty parameter, an index of what level of examinees for which the item is appropriate; typically ranges from -3 to +3, with 0 being an average examinee level.

   c: the pseudo-guessing parameter, which is a lower asymptote; typically is focused on 1/k where k is the number of options.


Item response function

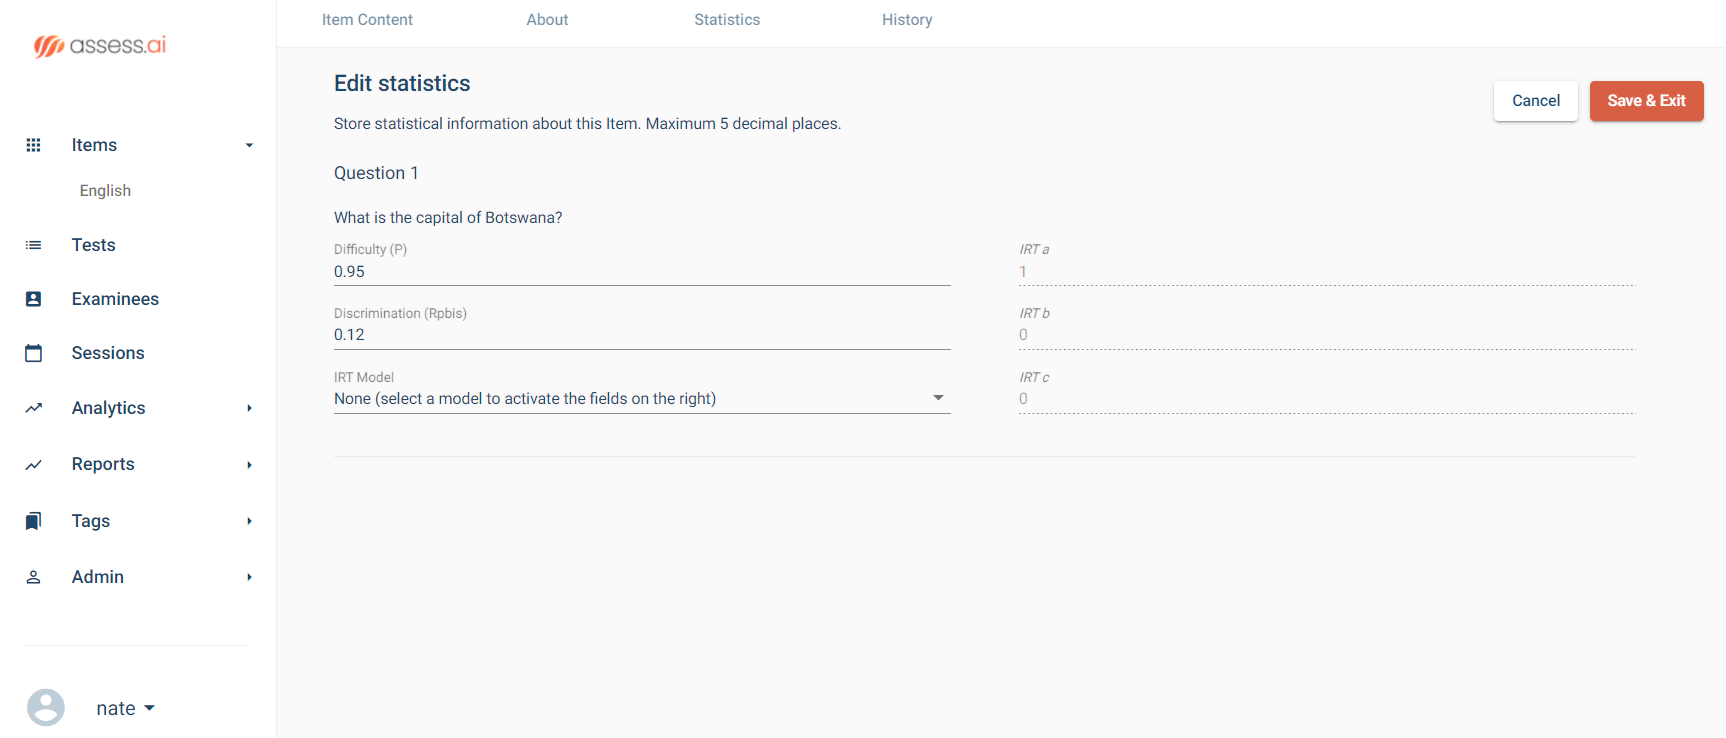
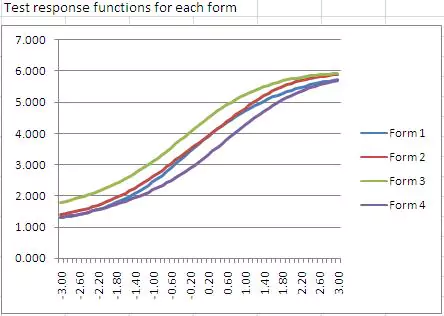
These parameters are used to graphically display an item response function (IRF), which models the probability of a correct answer as a function of ability.  In the example IRF, the a parameter is approximately, 1.0, indicating a fairly discriminating test item.  The b parameter is approximately 0.0 (the point on the x-axis where the midpoint of the curve is), indicating an average-difficulty item; examinees of average ability would have a 60% chance of answering correctly.  The c parameter is approximately 0.20, like a 5-option multiple choice item.  Consider the x-axis to be z-scores on a standard normal scale.

What does this mean conceptually?  We are trying to model the interaction of an examinee responding to an item, hence the name item response theory.

In some cases, there is no guessing involved, and we only use and b.  This is called the two-parameter model.  If we only use b, this is the one-parameter or Rasch Model.  Here is how that is calculated.

One-parameter-logistic-model-IRT

Example IRT calculations

Examinees with higher ability are much more likely to respond correctly.  Look at the graph above.  Someone at +2.0 (97th percentile) has about a 94% chance of getting the item correct.  Meanwhile, someone at -2.0 has only a 25% chance – barely above the 1 in 5 guessing rate of 20%.  An average person (0.0) has a 60% chance.  Why 60?  Because we are accounting for guessing.  If the curve went from 0% to 100% probability, then yes, the middle would be 50% change.  But here, we assume 20% as a baseline due to guessing, so halfway up is 60%.

five item response functions

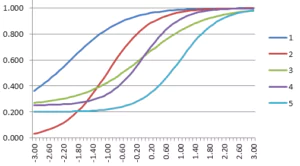
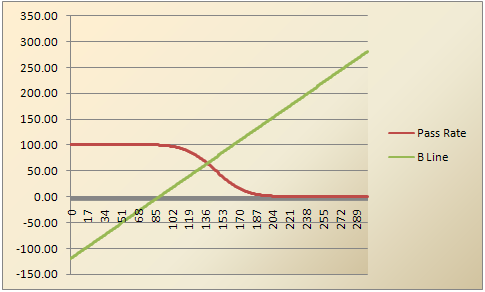
Of course, the parameters can and should differ from item to item, reflecting differences in item performance.  The following graph shows five IRFs with the three-parameter model.  The dark blue line is the easiest item, with a b of -2.00.  The light blue item is the hardest, with a b of +1.80.  The purple one has a c=0.00 while the light blue has c=0.25, indicating that it is more susceptible to guessing.

These IRFs are not just a pretty graph or a way to describe how an item performs.  They are the basic building block to accomplishing those important goals mentioned earlier.  That comes next…


Applications of IRT to Improve Assessment

Item response theory uses the IRF for several purposes.  Here are a few.

test information function from item response theory

  1. Interpreting and improving item performance
  2. Scoring examinees with maximum likelihood or Bayesian methods
  3. Form assembly, including linear on the fly testing (LOFT) and pre-equating
  4. Calculating the accuracy of examinee scores
  5. Development of computerized adaptive tests (CAT)
  6. Post-equating
  7. Differential item functioning (finding bias)
  8. Data forensics to find cheaters or other issues

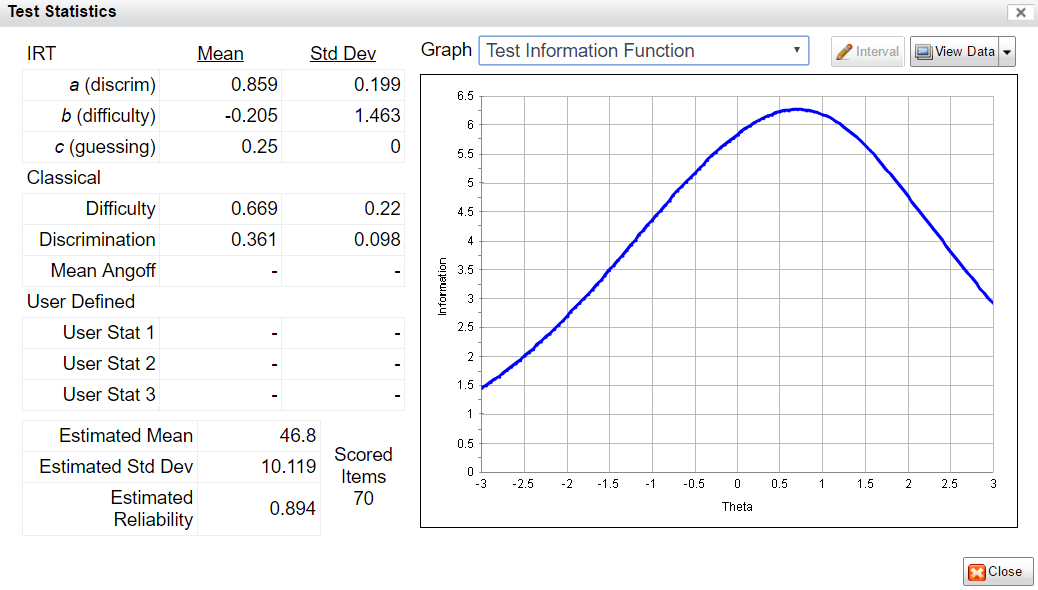
In addition to being used to evaluate each item individually, IRFs are combined in various ways to evaluate the overall test or form.  The two most important approaches are the conditional standard error of measurement (CSEM) and the test information function (TIF).  The test information function is higher where the test is providing more measurement information about examinees; if relatively low in a certain range of examinee ability, those examinees are not being measured accurately.  The CSEM is the inverse of the TIF, and has the interpretable advantage of being usable for confidence intervals; a person’s score plus or minus 1.96 times the SEM is a 95% confidence interval for their score.  The graph on the right shows part of the form assembly process in our  FastTest  platform.

Assumptions of IRT

Item response theory assumes a few things about your data.

  1. The latent trait you are measuring is unidimensional.  If it is multidimensional, there is multidimensional item response theory, or you can treat the dimensions as separate traits.
  2. Items have local independence, which means that the act of answering one is not impacted by others.  This affects the use of testlets and enemy items.
  3. The probability of responding correctly to an item (or in a certain response, in the case of polytomous like Likert), is a function of the examinee’s ability/trait level and the parameters of the model, following the calculation of the item response function, with some allowance for random error.  As a corollary, we are assuming that the ability/trait has some distribution, with some people having higher or lower levels (e.g., intelligence) and that we are trying to find those differences.

Many texts will only postulate the first two as assumptions, because the third is just implicitly assumed.


Advantages and Benefits of Item Response Theory

So why does this matter?  Let’s go back to the problems with classical test theory.  Why is IRT better?

  • Sample-independence of scale: Classical statistics are all sample dependent, and unusable on a different sample; results from IRT are sample-independent. within a linear transformation.  Two samples of different ability levels can be easily converted onto the same scale.
  • Test statistics: Classical statistics are tied to a specific test form.
  • Sparse matrices are OK: Classical test statistics do not work with sparse matrices introduced by multiple forms, linear on the fly testing, or adaptive testing.
  • Linking/equating: Item response theory has much stronger equating, so if your exam has multiple forms, or if you deliver twice per year with a new form, you can have much greater validity in the comparability of scores.
  • Measuring the range of students: Classical tests are built for the average student, and do not measure high or low students very well; conversely, statistics for very difficult or easy items are suspect.
  • Vertical scaling: IRT can do vertical scaling but CTT cannot.
  • Lack of accounting for guessing: CTT does not account for guessing on multiple choice exams.
  • Scoring: Scoring in classical test theory does not take into account item difficulty.  With IRT, you can score a student on any set of items and be sure it is on the same latent scale.
  • Adaptive testing: CTT does not support adaptive testing in most cases.  Adaptive testing has its own list of benefits.
  • Characterization of error: CTT assumes that every examinee has the same amount of error in their score (SEM); IRT recognizes that if the test is all middle-difficulty items, then low or high students will have inaccurate scores.
  • Stronger form building: IRT has functionality to build forms to be more strongly equivalent and meet the purposes of the exam.
  • Nonlinear function: IRT does not assume linear function of the student-item relationship when it is impossible.  CTT assumes a linear function (point-biserial) when it is blatantly impossible.

IRT Models: One Big Happy Family

Remember: Item response theory is actually a family of models, making flexible use of the parameters.  In some cases, only two (a,b) or one parameters (b) are used, depending on the type of assessment and fit of the data.  If there are multipoint items, such as Likert rating scales or partial credit items, the models are extended to include additional parameters. Learn more about the partial credit situation here.

Here’s a quick breakdown of the family tree, with the most common models.


How do I analyze my test with item response theory?

OK item fit

First: you need to get special software.  There are some commercial packages like Xcalibre, or you can use packages inside platforms like R and Python.

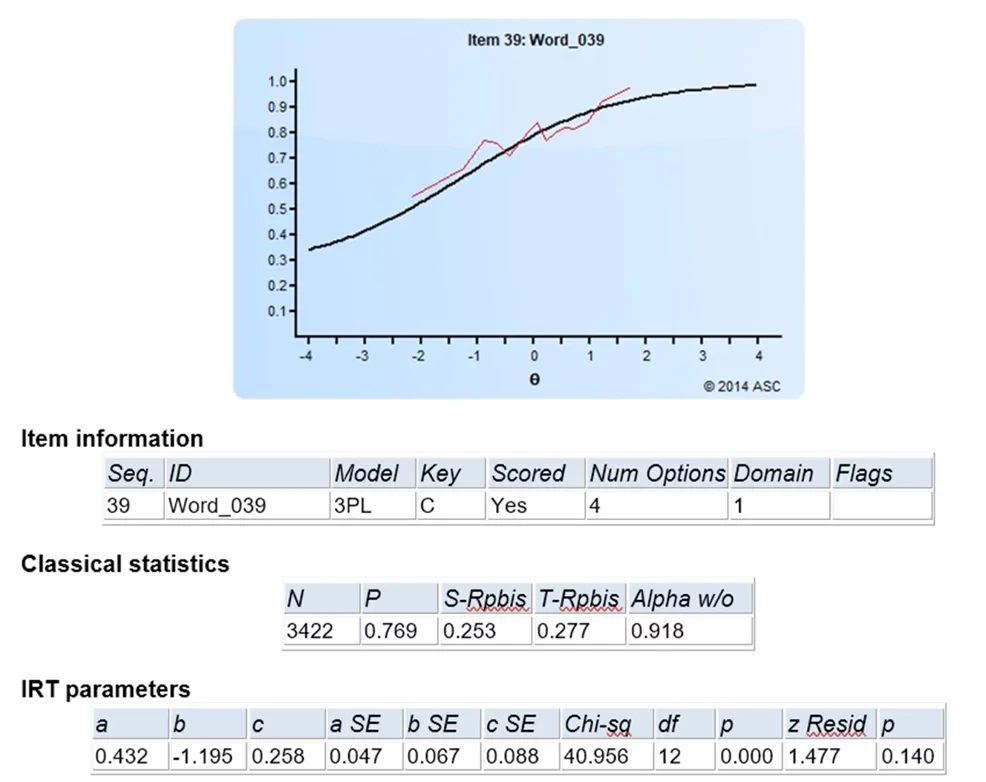
The software will analyze the data in cycles or loops to try to find the best model.  This is because, as always, the data does not always perfectly align.  You might see graphs like the one below if you compared actual proportions (red) to the predicted ones from the item response function (black).  That’s OK!  IRT is quite robust.  And there are analyses built in to help you evaluate model fit.

Some more unpacking of the image above:

  • This was item #39 on the test
  • Xcalibre-poly-outputWe are using the three parameter logistic model (3PL), as this was a multiple choice item with 4 options
  • 3422 examinees answered the item
  • 76.9 of them got it correct
  • The classical item discrimination (point biserial item-total correlation) was 0.253, which is OK but not very high
  • The a parameters was 0.432, which is OK but not very strong
  • The b parameter was -1.195, which means the item was quite easy
  • The c parameter was 0.248, which you would expect if there was a 25% chance of guessing
  • The Chi-square fit statistic rejected the null, indicating poor fit, but this statistic is susceptible to sample size
  • The z-Resid fit statistic is a bit more robust, and it did not flag the item for bad fit

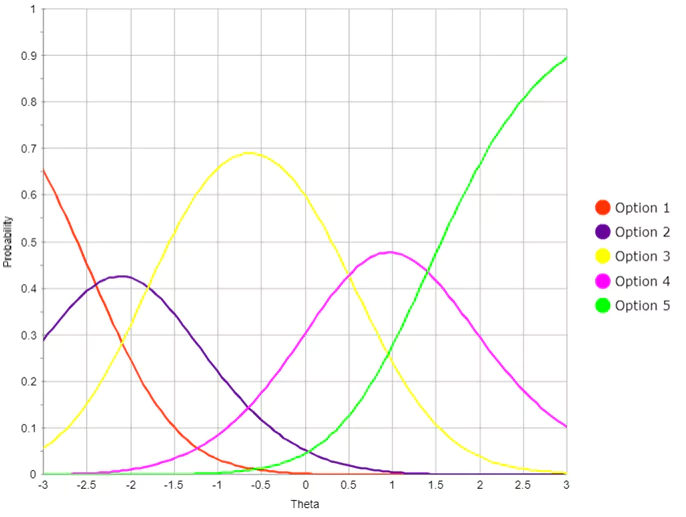
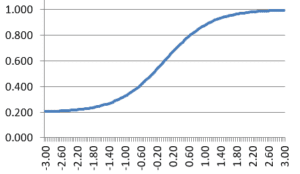
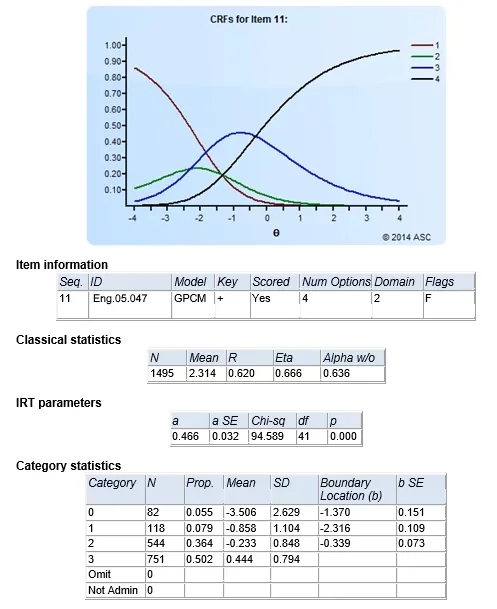
The image here shows output from Xcalibre from the generalized partial credit model, which is a polytomous model often used for items scored with partial credit.  For example, if a question lists 6 animals and asks students to click on the ones that are reptiles, of which there are 3.  The possible scores are then 0, 1, 2, 3.  Here, the graph labels them as 1-2-3-4, but the meaning is the same.  Someone is likely to get 0 points if their theta is below -2.0 (bottom 3% or so of students).  A few low students might get 1 point (green), low-middle ability students are likely to get 2 correct (blue) and anyone above average (0.0) is likely to get all 3 correct.

Where can I learn more?

For more information, we recommend the textbook Item Response Theory for Psychologists by Embretson & Riese (2000) for those interested in a less mathematical treatment, or de Ayala (2009) for a more mathematical treatment.  If you really want to dive in, you can try the 3-volume Handbook of Item Response Theory edited by van der Linden, which contains a chapter discussing ASC’s IRT analysis software,  Xcalibre.

Want to talk to one of our experts about how to apply IRT?  Get in touch!

TALK TO US Contact