Distractor analysis for test items
Distractor analysis refers to the process of evaluating the performance of incorrect answers vs the correct answer for multiple choice items on a test. It is a key step in the psychometric analysis process to evaluate item and test performance as part of documenting test reliability and validity.
What is a distractor?
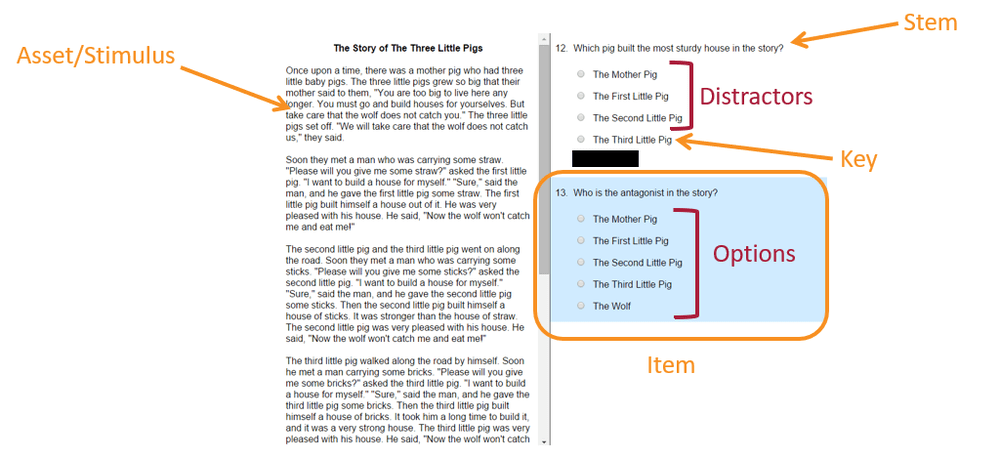
Multiple-choice questions always have a few options for an answer, one of which is a key/correct answer, and the remaining ones are distractors/wrong answers. It is worth noting that distractors should not be just any wrong answers but have to be probable answers in case an examinee makes a mistake when looking for a right option. In short, distractors are feasible answers that a examinee might select when making misjudgments or having partial knowledge/understanding. A great example is later in this article with the word “confectioner.”
After a test form is delivered to examinees, distractor analysis should be implemented to make sure that all answer options work well, and that the item is performing well and defensibly. For example, it is expected that around 40-95% of students pick a correct answer, and the distractors will be chosen by the smaller number of examinees compared to the number chosen the key with approximately equal distribution of choices.
Distractor analysis is usually done with classical test theory, even if item response theory is used for scoring, equating, and other tasks.
How to do a distractor analysis
There are three main aspects:
- Option frequencies/proportions
- Option point-biserial
- Quantile plot
The option frequencies/proportions just refers to the analysis of how many examinees selected each answer. Usually it is a proportion and labeled as “P.” Did 70% choose the correct answer while the remaining 30% were evenly distributed amongst the 3 distractors? Great. But if only 40% chose the correct answer and 45% chose one of the distractors, you might have a problem on your hands. Perhaps the answer specified as the Key was not actually correct.
The point-biserials (Rpbis) will help you evaluate if this is the case. The point-biserial is an item-total correlation, meaning that we correlate scores on the item with the total score on the test, which is a proxy index of examinee ability. If 0.0, there is no relationship, which means the item is not correlated with ability, and therefore probably not doing any good. If negative, it means that the lower-ability students are selecting it more often; if positive, it means that the higher-ability students are selecting it more often. We want the correct answer to have a positive value and the distractors to have a negative value. This is one of the most important points in determining if the item is performing well.
In addition, there is a third approach, which is visual, called the quantile plot. It is very useful for diagnosing how an item is working and how it might be improved. This splits the sample up into blocks ordered by performance, such as 5 groups where Group 1 is 0-20th percentile, Group 2 is 21-40th, etc. We expect the smartest group to have a high proportion of examinees selecting the correct answer and low proportion selecting the distractors, and vise versa. You can see how this aligns with the concept of point-biserial. An example of this is below.
Note that the P and point-biserial for the correct answer serve as “the” statistics for the item as a whole. The P for the item is called the item difficulty or facility statistic.
Examples of distractor analysis
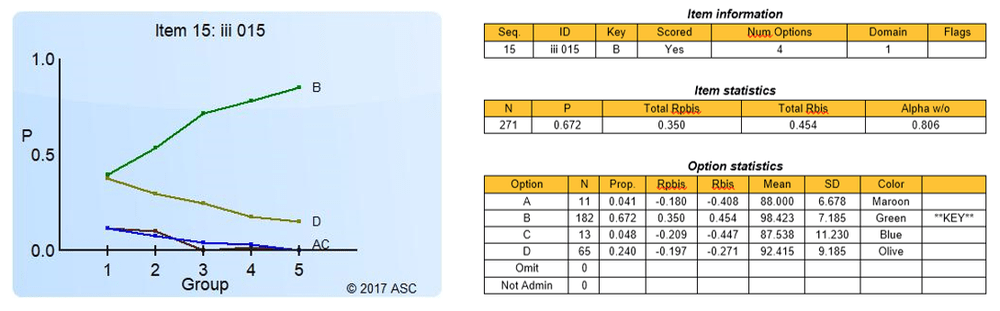
Here is an example of a good item. The P is medium (67% correct) and the Rpbis is strongly positive for the correct answer while strongly positive for the incorrect answers. This translates to a clean quantile plot where the curve for the correct answer (B) goes up while the curves for the incorrect answers go down. An ideal situation.
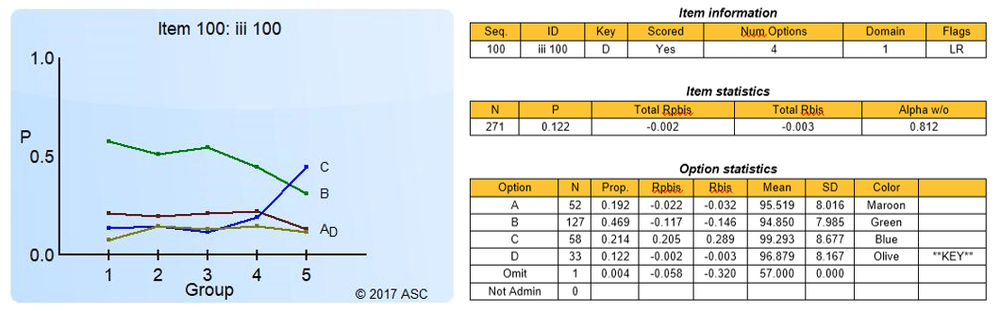
Now contrast that with the following item. Here, only 12% of examinees got this correct, and the Rpbis was negative. Answer C had 21% and a nicely positive Rpbis, as well as a quantile curve that goes up. This item should be reviewed to see if C is actually correct. Or B, which had the most responses. Most likely, this item will need a total rewrite!
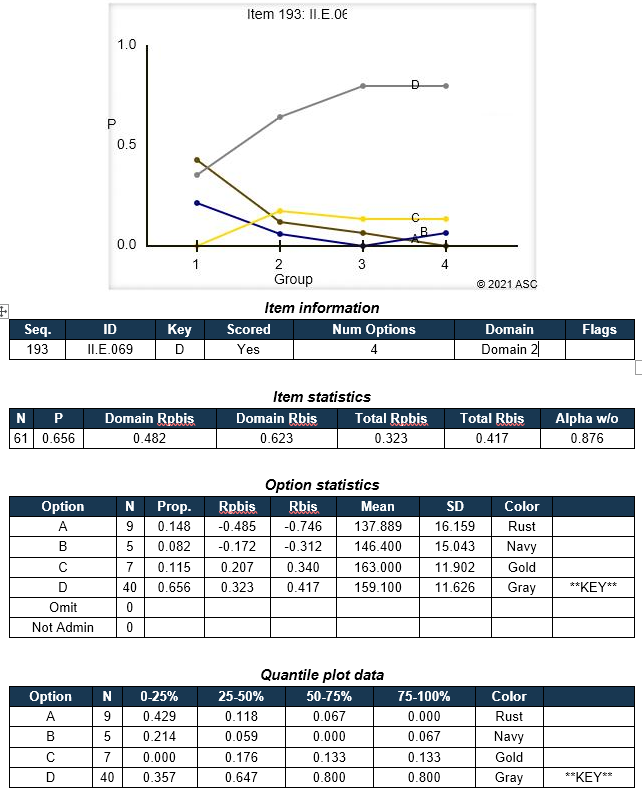
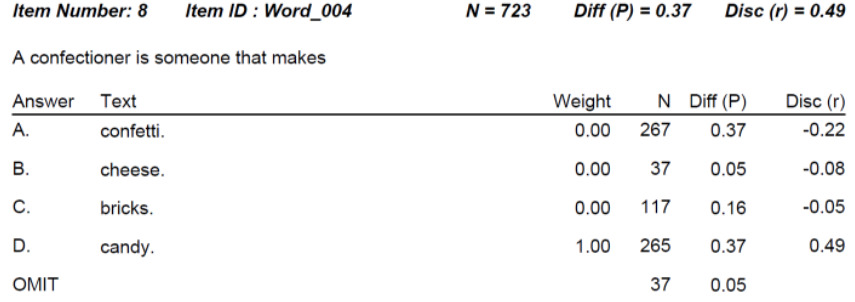
Note that an item can be extremely difficult but still perform well. Here is an example where the distractor analysis supports continued use of the item. The distractor is just extremely attractive to lower students; they think that a confectioner makes confetti, since those two words look the closest. Look how strong the Rpbis is here, and very negative for that distractor. This is a good result!
Nathan Thompson, PhD
Latest posts by Nathan Thompson, PhD (see all)
- What is a T score? - April 15, 2024
- Item Review Workflow for Exam Development - April 8, 2024
- Likert Scale Items - February 9, 2024