IRT Test Information Function
The IRT Test Information Function is a concept from item response theory (IRT) that is designed to evaluate how well an assessment differentiates examinees, and at what ranges of ability. For example, we might expect an exam composed of difficult items to do a great job in differentiating top examinees, but it is worthless for the lower half of examinees because they will be so confused and lost.
The reverse is true of an easy test; it doesn’t do any good for top examinees. The test information function quantifies this and has a lot of other important applications and interpretations.
IRT Test Information Function: how to calculate it
The test information function is not something you can calculate by hand. First, you need to estimate item-level IRT parameters, which define the item response function. The only way to do this is with specialized software; there are a few options in the market, but we recommend Xcalibre.
Next, the item response function is converted to an item information function for each item. The item information functions can then be summed into a test information function. Lastly, the test information function is often inverted into the conditional standard error of measurement function, which is extremely useful in test design and evaluation.
IRT Item Parameters
Software like Xcalibre will estimate a set of item parameters. The parameter you use depends on the item types and other aspects of your assessment.
For example, let’s just use the 3-parameter model, which estimates a, b, and c. And we’ll use a small test of 5 items. These are ordered by difficulty: item 1 is very easy and Item 5 is very hard.
| Item | a | b | c |
| 1 | 1.00 | -2.00 | 0.20 |
| 2 | 0.70 | -1.00 | 0.40 |
| 3 | 0.40 | 0.00 | 0.30 |
| 4 | 0.80 | 1.00 | 0.00 |
| 5 | 1.20 | 2.00 | 0.25 |
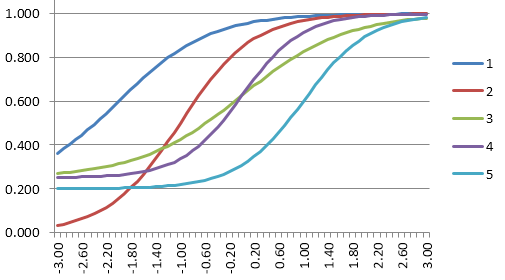
Item Response Function
The item response function uses the IRT equation to convert the parameters into a curve. The purpose of the item parameters is to fit this curve for each item, like a regression model to describe how it performs.
Here are the response functions for those 5 items. Note the scale on the x-axis, similar to the bell curve, with the easy items to the left and hard ones to the right.
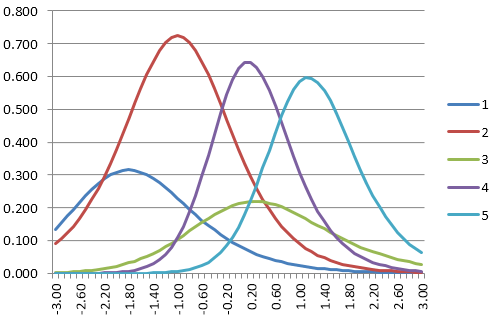
Item Information Function
The item information function evaluates the calculus derivative of the item response function. An item provides more information about examinees where it provides more slope.
For example, consider Item 5: it is difficult, so it is not very useful for examinees in the bottom half of ability. The slope of the Item 5 IRF is then nearly 0 for that entire range. This then means that its information function is nearly 0.
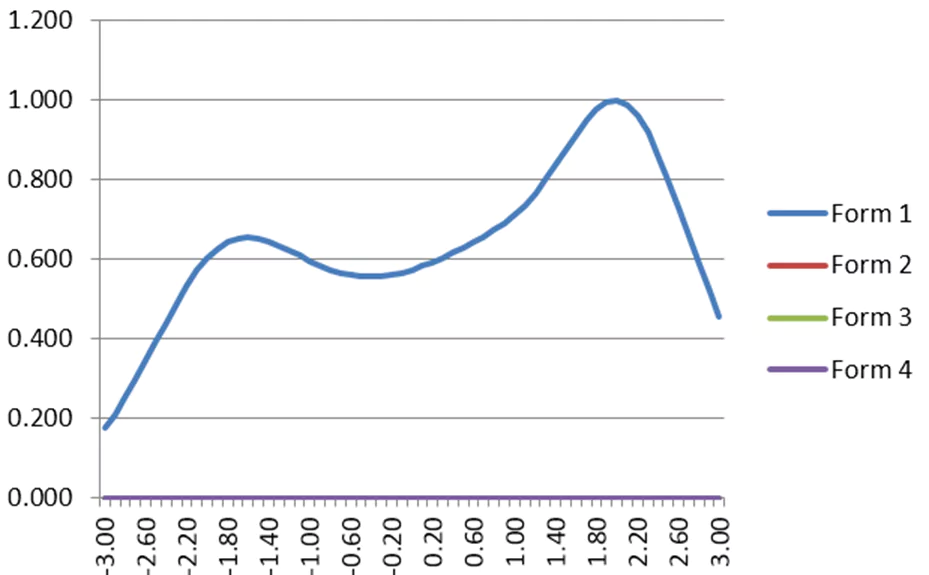
Test Information Function
The test information function then sums up the item information functions to summarize where the test is providing information. If you imagine adding the graphs above, you can easily imagine some humps near the top and bottom of the range where there are the prominent IIFs.
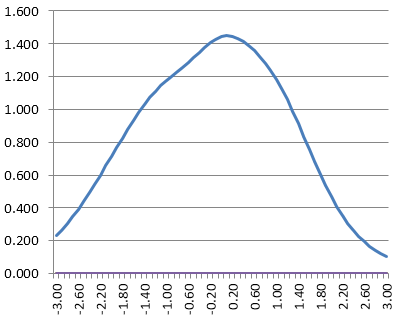
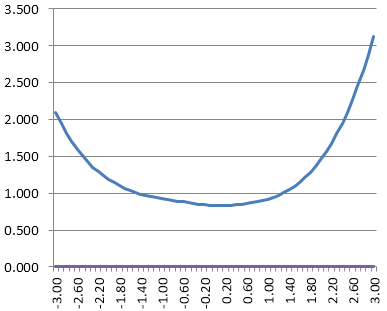
Conditional Standard Error of Measurement Function
The test information function can be inverted into an estimate of the conditional standard error of measurement. What do we mean by conditional? If you are familiar with classical test theory, you know that it estimates the same standard error of measurement for everyone that takes a test.
But given the reasonable concepts above, it is incredibly unreasonable to expect this. If a test has only difficult items, then it measures top students well, and does not measure lower students well, so why should we say that their scores are just as accurate? The conditional standard error of measurement turns this into a function of ability.
Also, note that it refers to the theta scale and not to the number-correct scale.
How can I implement all this?
For starters, I recommend delving deeper into an item response theory book. My favorite is Item Response Theory for Psychologists by Embretson and Riese. Next, you need some item response theory software.
Xcalibre can be downloaded as a free version for learning and is the easiest program to learn how to use (no 1980s-style command code… how is that still a thing?). But if you are an R fan, there are plenty of resources in that community as well.
Tell me again: why are we doing this?
The purpose of all this is to effectively model how items and tests work, namely, how they interact with examinees. This then allows us to evaluate their performance so that we can improve them, thereby enhancing reliability and validity.
Classical test theory had a lot of shortcomings in this endeavor, which led to IRT being invented. IRT also facilitates some modern approaches to assessment, such as linear on-the-fly testing, adaptive testing, and multistage testing.
Nathan Thompson, PhD
Latest posts by Nathan Thompson, PhD (see all)
- What is a T score? - April 15, 2024
- Item Review Workflow for Exam Development - April 8, 2024
- Likert Scale Items - February 9, 2024