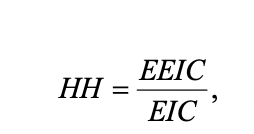
Harpp and Hogan (1993) suggested a response similarity index defined as
Response Similarity Index Explanation
EEIC denote the number of exact errors in common or identically wrong, EIC is the number of errors in common.
This is calculated for all pairs of examinees that the researcher wishes to compare.
One advantage of this approach is that it is extremely simple to interpret: if examinee A and B each get 10 items wrong, 5 of which are in common, and gave the same answer on 4 of those 5, then the index is simply 4/5 = 0.80. A value of 1.0 would therefore be perfect “cheating” – on all items that both examinees answered incorrectly, they happened to select the same distractor.
The authors suggest utilizing a flag cutoff of with the following reasoning (Harpp & Hogan, 1993, p. 307):
The choice of 0.75 is derived empirically because pairs with less than this fraction were not found to sit adjacent to one another while pairs with greater than this ratio almost always were seated adjacently.
The cutoff can differ from dataset to dataset, so SIFT allows you to specify the cutoff you wish to use for flagging pairs of examinees. However, because this cutoff is completely arbitrary, a very high value (e.g., 0.95) is recommended by as this index can easily lead to many flaggings, especially if the test is short. False positives are likely, and this index should be used with great caution. Wesolowsky (unpublished PowerPoint presentation) called this method “better but not good.”
You may also be interested in the revised version of this index produced by Harpp, Hogan, and Jennings in 1996.

Nathan Thompson earned his PhD in Psychometrics from the University of Minnesota, with a focus on computerized adaptive testing. His undergraduate degree was from Luther College with a triple major of Mathematics, Psychology, and Latin. He is primarily interested in the use of AI and software automation to augment and replace the work done by psychometricians, which has provided extensive experience in software design and programming. Dr. Thompson has published over 100 journal articles and conference presentations, but his favorite remains https://scholarworks.umass.edu/pare/vol16/iss1/1/ .