The item-total point-biserial correlation is a common psychometric index regarding the quality of a test item, namely how well it differentiates between examinees with high vs low ability.
What is item discrimination?
While the word “discrimination” has a negative connotation, it is actually a really good thing for an item to have. It means that it is differentiating between examinees, which is entirely the reason that an assessment item exists. If a math item on Fractions is good, then students with good knowledge of fractions will tend to get it correct, while students with poor knowledge will get it wrong. If this isn’t the case, and the item is essentially producing random data, then it has no discrimination. If the reverse is the case, then the discrimination will be negative. This is a total red flag; it means that good students are getting the item wrong and poor students are getting it right, which almost always means that there is incorrect content or the item is miskeyed.
What is the point-biserial correlation?
The point-biserial coefficient is a Pearson correlation between scores on the item (usually 0=wrong and 1=correct) and the total score on the test. As such, it is sometimes called an item-total correlation.
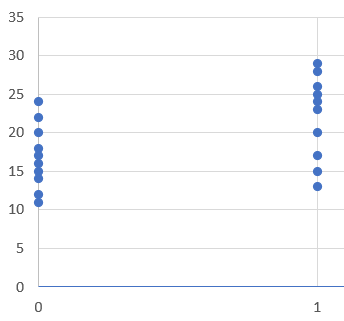
Consider the example below. There are 10 examinees that got the item wrong, and 10 that got it correct. The scores are definitely higher for the Correct group. If you fit a regression line, it would have a positive slope. If you calculated a correlation, it would be around 0.10.

How do you calculate the point-biserial?
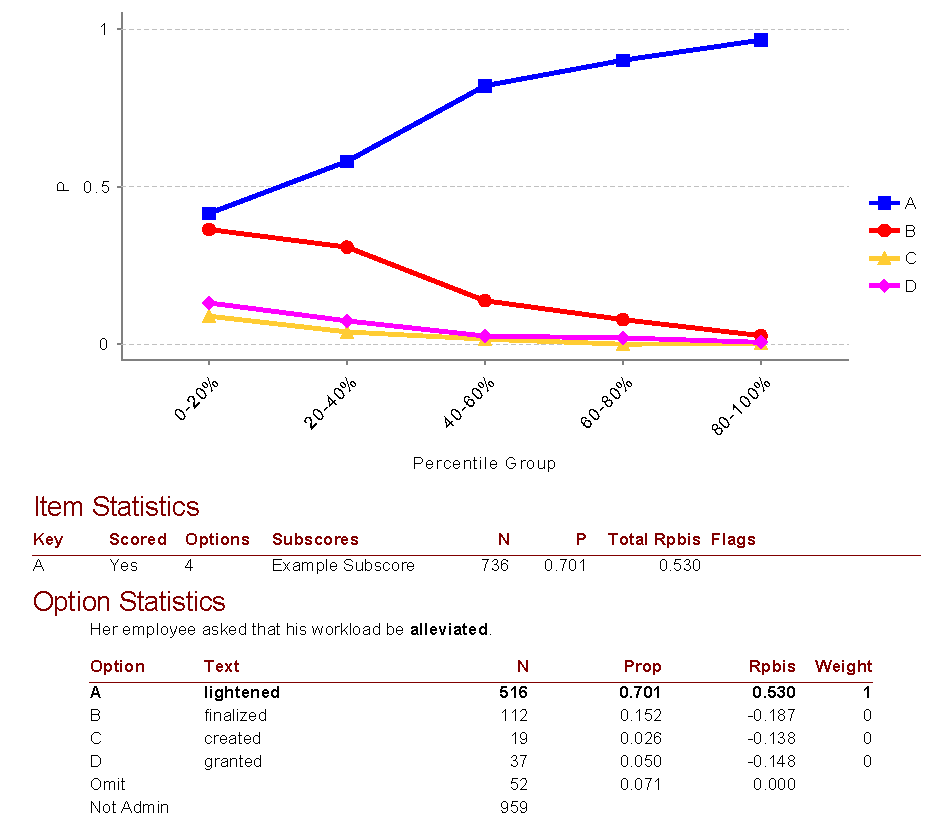
Since it is a Pearson correlation, you can easily calculate it with the CORREL function in Excel or similar software. Of course, psychometric software like Iteman will also do it for you, and many more important things besides (e.g., the point-biserial for each of the incorrect options!). This is an important step in item analysis. The image below is example output from Iteman, where Rpbis is the point-biserial. This item is very good, as it has a very high point-biserial for the correct answer and strongly negative point-biserials for the incorrect answers (which means the not-so-smart students are selecting them).

How do you interpret the point-biserial?
Well, most importantly consider the points above about near-zero and negative values. Besides that, a minimal-quality item might have a point-biserial of 0.10, a good item of about 0.20, and strong items 0.30 or higher. But, these can vary with sample size and other considerations. Some constructs are easier to measure than others, which makes item discrimination higher.
Are there other indices?
There are two other indices commonly used in classical test theory. There is the cousin of the point-biserial, the biserial. There is also the top/bottom coefficient, where the sample is split into a highly performing group and a lowly performing group based on total score, the P value calculated for each, and those subtracted. So if 85% of top examinees got it right and 60% of low examinees got it right, the index would be 0.25.
Of course, there is also the a parameter from item response theory. There are a number of advantages to that approach, most notably that the classical indices try to fit a linear model on something that is patently nonlinear. For more on IRT, I recommend a book like Embretson & Riese (2000).

Nathan Thompson earned his PhD in Psychometrics from the University of Minnesota, with a focus on computerized adaptive testing. His undergraduate degree was from Luther College with a triple major of Mathematics, Psychology, and Latin. He is primarily interested in the use of AI and software automation to augment and replace the work done by psychometricians, which has provided extensive experience in software design and programming. Dr. Thompson has published over 100 journal articles and conference presentations, but his favorite remains https://scholarworks.umass.edu/pare/vol16/iss1/1/ .
