Computerized classification testing (CCT) refers to tests or assessments that are delivered to people, obviously via computer, for the purpose of classifying them into groups. Unlike traditional testing, which aims to estimate a student’s ability along a continuum, CCT focuses on making a decision about which category or classification an individual falls into—for example, pass/fail, proficient/not proficient, or ready/not ready. The “computerized” part refers to the use of algorithms to make decisions more rapidly and efficiently. This makes it part of the family of personalized assessment, with computerized adaptive testing – similar algorithms but to obtain a precise score on a continuum rather than make decisions like pass/fail.
Why is this important? The “rapidly” can be extremely rapid. Like, possibly saving 80% of test length. If you are paying for seat time, or taking people away from their jobs to take the test, this can provide a large financial return. It also has more subjective benefits, such as making the examinees happier for not having to take such long tests.
How can we do this? Well, consider if you have a 100 item test, and you give someone the easiest 20 items and the get every single one wrong. If the passing score on the test is 70, the probability that they will pass is virtually zero. Why give them another 80 items?
There are various ways to calculate this decision, and how to select the items, which is what this post will cover.
Introduction to Computerized Classification Testing
CCT (Lin & Spray, 2000) is widely used in high-stakes testing environments such as certification, licensure, and military aptitude evaluations. Its efficiency stems from its adaptive nature. Rather than administering a fixed set of questions to all examinees, a CCT adapts the items based on a candidate’s responses, administering only as many items as necessary to make a confident classification. This approach reduces test length and enhances the examinee experience without compromising decision accuracy.
There are two types of algorithms for CCT.
- Utilize item response theory to obtain a score (theta) and standard error for each examinee after each item, and make a confidence interval to compare to the cutscore on the theta continuum.
- Utilize statistical decision procedures rooted in hypothesis testing and sequential analysis. This can be done with item response theory, but also in some cases with classical test theory, termed measurement decision theory by Larry Rudner.
Among the most influential approaches in the latter paradigm is the Sequential Probability Ratio Test (SPRT), a method that originated in the mid-20th century but has found renewed importance with the rise of computerized testing. To understand SPRT and its significance, we must first explore the work of the man behind it: Abraham Wald.
Abraham Wald: The Father of Sequential Analysis
Abraham Wald, an Austrian-American mathematician, was a pioneer in the field of statistical decision theory. Born in 1902, Wald made significant contributions across multiple domains, including econometrics, geometry, and operations research.
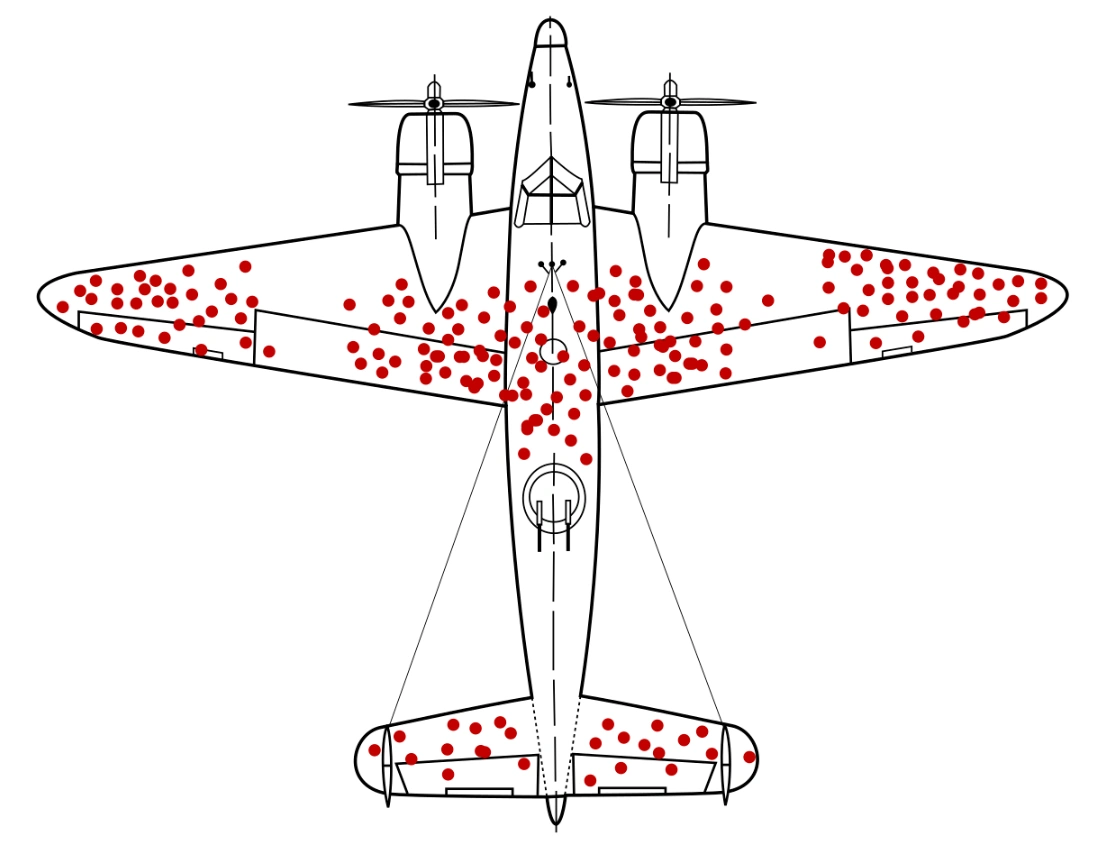
One of his most famous studies was regarding where to protect planes from flak damage in World War II. He suggested that every plane returning from missions should be examined for holes, and they would be noted on a diagram like you see here. Your first notion might be to add more armor where there are more dots. But Wald realized that the flak was a random variable. The areas where there were no dots were where the damage occurred on the planes that did not make it back. More armor is necessary in those areas.
However, his most enduring legacy lies in his development of sequential analysis during World War II. While working for the U.S. military, Wald was tasked with improving the efficiency of quality control testing for munitions and aircraft. Traditional methods involved testing a fixed number of items, but Wald proposed a novel approach: evaluate evidence as it comes in and make decisions dynamically. This led to the development of the Sequential Probability Ratio Test (SPRT), a groundbreaking method for comparing two hypotheses in a more data-efficient way.
Wald’s contributions were foundational not only to modern statistics but also to practical applications in defense, manufacturing, and education. His work remains deeply influential in CAT and CCT, where sequential decision-making can greatly enhance test efficiency.
Sequential Probability Ratio Test (SPRT): The Core of CCT
At the core of computerized classification testing lies the Sequential Probability Ratio Test, which Wald designed to determine whether to accept or reject a hypothesis as data are collected.
SPRT works by evaluating the likelihood ratio of two hypotheses after each observation, such as testing a light bulb that is coming off an assembly line:
H₀ (null hypothesis): The quality of the lot (defective rate) is below an acceptable rate.
H₁ (alternative hypothesis): The quality of the lot (defective rate) is above an acceptable rate.
After each light bulb, the test calculates a likelihood ratio of H₁ to H₀. If the ratio exceeds an upper boundary, the test accepts H₁ (e.g., the student passes). If it falls below a lower boundary, the test accepts H₀ (e.g., the student fails). If the ratio falls between the boundaries, the test continues. For a full treatment of this and discussion of how to define the rates and the boundaries, see the Wikipedia article and other mathematical treatments.
This dynamic approach offers two main benefits:
Efficiency: The test often stops early, reducing the number of light bulbs needed.
Control over error rates: The boundaries can be calibrated to control the probability of making false positive or false negative classifications.
How the SPRT works with psychometrics
In the context of CCT, SPRT is used to classify an examinee into one of two categories, such as pass or fail, based on their responses to test questions, one at a time.
H₀ (null hypothesis): The examinee’s ability is at a a point below the cutscore (e.g., not proficient).
H₁ (alternative hypothesis): The examinee’s ability is at a point above the cutscore (e.g., proficient).
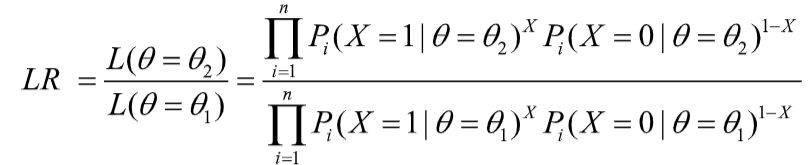
Operationally, this happens by specifying points on theta above and below the cutscore. For example, the cutscore might be -0.4, and we say that the lower point is -0.5 and the upper point is -0.3. We then take the probability at each of these points weighted by whether the observation for that item was correct or incorrect, and multiply it across all items. The mathematical form of the SPRT with IRT is shown here.
The space between these is called the indifference region, because we are saying that we are indifferent about the result. We would accept a someone of up to -0.3 to fail, and of down to -0.5 to pass. Also note that the width of the indifference region will matter, by changing the difference between the values. You need to conduct simulations to investigate the best width of the indifference region for your test validation.
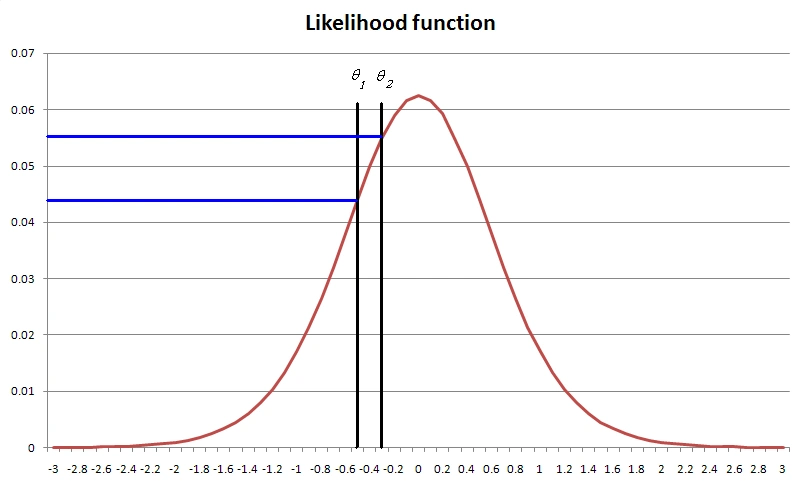
Alternatively, we calculate the y-axis value IRT scoring likelihood function at each of these points, and compare them in a ratio. Note that we do not need the entire function, or need to find the maximum via Newton-Raphson. The graphic here shows our example. The y-axis values are 0.55 and 0.44. We would compare the ratio 0.55/0.44 = 1.25 to the boundary values and decide whether to pass, fail, or deliver another item. In this example, the examinee is currently passing, since they are above the cutscore, but not by much, so the test will administer another item.
Expanding to the generalized likelihood ratio
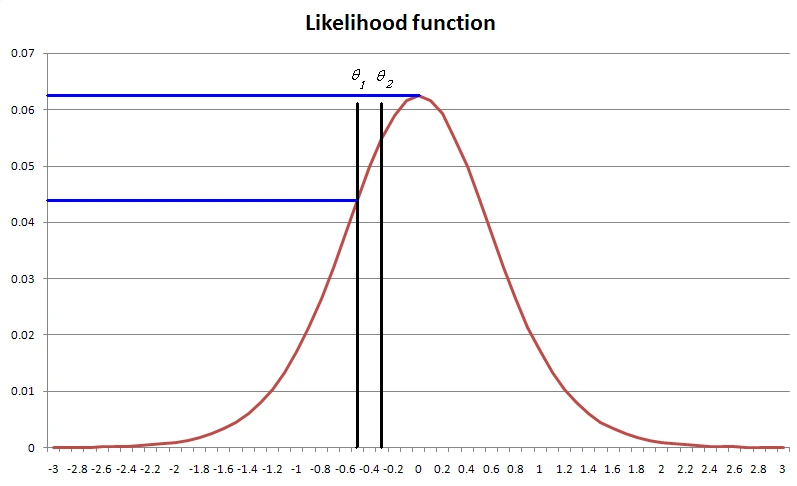
The Generalized Likelihood Ratio Test (GLRT) expands the SPRT by changing how the values are found. The key is that we are dealing not with a point hypothesis, but a composite hypothesis – that the person has a score above theta-2, not right at it. You might notice in the graph above that 0.55 is not the highest likelihood of a passing examinee. It is 0.62, around theta of 0.00. So we take this value into our ratio instead, which will make it larger, and bring us closer to the Pass decision. Research shows that this approach is more efficient in the aggregate than the SPRT.
A different approach: Confidence intervals
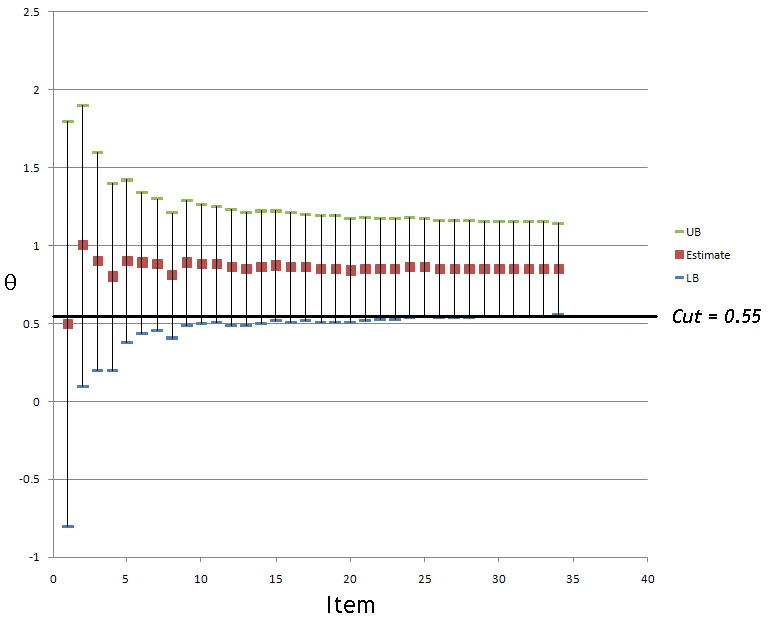
This approach was developed independently by David J Weiss (cofounder of ASC) and colleagues. As mentioned above, you take a confidence interval around the theta estimate, and compare to the cutscore after every item. If the band is above the cutscore you pass, and if below, you fail. This approach is used by the NCLEX nursing exam in the USA. There have been some comparison studies to the other methods, including early work by me, which found this to be less efficient because it focuses on obtaining a score rather than a decision. Especially if the items are selected adaptively, across the continuum, rather than near the cutscore where more information is needed.
Applications of sequential analysis in assessment and psychometrics
The earliest example of this approach that I know of was the 1969 dissertation of Richard Ferguson, who later became the CEO of ACT. The confidence intervals approach was developed in the late 1970s, and published in a book chapter in 1983 by Weiss and Kingsbury. Coincidentally, the SPRT was first applied to IRT and assessment in the very next chapter by Mark Reckase. Quite the book!
While we have focused this discussion on the case of a single cutscore, the algorithms here can easily be extended to the case of multiple cutscores. For example, classifying language mastery into CEFR levels, or students into Basic/Proficient/Advanced mastery.
This is what my dissertation was about; comparing the confidence interval and SPRT approaches in the two-cutscore situation, and how to apply the generalized partial credit model to make the test even more efficient. As I did the work, I felt that the SPRT didn’t feel right, but it took me a long time in those days to find the GLR. And by then, I was no longer doing academic research.
I’d like to mention that one of the research leaders in this topic was Theo Eggen in the Netherlands, with multiple journal articles. Both Theo and Larry Rudner recently passed away at the time I am writing this; I’m grateful for their work, mentorship, and friendship.
Why does this all matter?
As mentioned earlier, CCT and its cousin CAT are extremely powerful and efficient technologies. They can drastically reduce the length of tests with no loss in accuracy. This provides subjective benefits to the examinees, increases security, and most importantly can have massive financial benefits. Though in some cases, the savings is not purely financial; if you are saving 2 hours of testing from millions of K-12 students, that is also very valuable, but hard to put a number against.
However, building and validating such tests is not easy. It will take a team of experts. This keeps it from being feasible at a small scale. However, I highly recommend that you consider the CCT approach if you are managing large-scale exams that deal primarily with classification testing.

Nathan Thompson earned his PhD in Psychometrics from the University of Minnesota, with a focus on computerized adaptive testing. His undergraduate degree was from Luther College with a triple major of Mathematics, Psychology, and Latin. He is primarily interested in the use of AI and software automation to augment and replace the work done by psychometricians, which has provided extensive experience in software design and programming. Dr. Thompson has published over 100 journal articles and conference presentations, but his favorite remains https://scholarworks.umass.edu/pare/vol16/iss1/1/ .