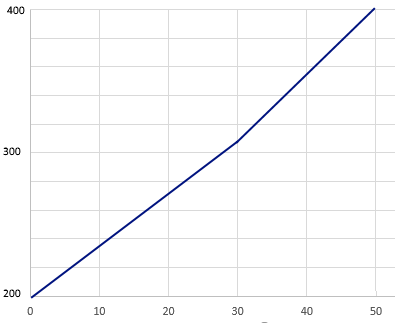
There are 4 types of scaled scoring. The rest of this post will get into some psychometric details on these, for advanced readers.
- Normal/standardized
- Linear
- Linear dogleg
- Equipercentile
Normal/standardized
This is an approach to scaled scoring that many of us are familiar with due to some famous applications, including the T score, IQ, and large-scale assessments like the SAT. It starts by finding the mean and standard deviation of raw scores on a test, then converts whatever that is to another mean and standard deviation. If this seems fairly arbitrary and doesn’t change the meaning… you are totally right!
Let’s start by assuming we have a test of 50 items, and our data has a raw score average of 35 points with an SD of 5. The T score transformation – which has been around so long that a quick Googling can’t find me the actual citation – says to convert this to a mean of 50 with an SD of 10. So, 35 raw points become a scaled score of 50. A raw score of 45 (2 SDs above mean) becomes a T of 70. We could also place this on the IQ scale (mean=100, SD=15) or the classic SAT scale (mean=500, SD=100).
A side not about the boundaries of these scales: one of the first things you learn in any stats class is that plus/minus 3 SDs contains 99% of the population, so many scaled scores adopt these and convenient boundaries. This is why the classic SAT scale went from 200 to 800, with the urban legend that “you get 200 points for putting your name on the paper.” Similarly, the ACT goes from 0 to 36 because it nominally had a mean=18 and SD=6.
The normal/standardized approach can be used with classical number-correct scoring, but makes more sense if you are using item response theory, because all scores default to a standardized metric.
Linear
The linear approach is quite simple. It employs the y=mx+b that we all learned as schoolkids. With the previous example of a 50 item test, we might say intercept=200 and slope=4. This then means that scores range from 200 to 400 on the test.
Yes, I know… the Normal conversion above is technically linear also, but deserves its own definition.
Linear dogleg
The Linear Dogleg approach is a special case of the previous one, where you need to stretch the scale to reach two endpoints. Let’s suppose we published a new form of the test, and a classical equating method like Tucker or Levine says that it is 2 points easier and the slope of Form A to Form B is 3.8 rather than 4. This throws off our clean conversion of 200 to 400 scale. So suppose we use the equation SCALED = 200 + 3.8*RAW but only up until the score of 30. From 31 onwards, we use SCALED = 185 + 4.3*RAW. Note that the raw score of 50 then still comes out to be scaled of 400, so we still go from 200 to 800 but there is now a slight bend in the line. This is called the “dogleg” similar to the golf hole of the same name.

Equipercentile
Lastly, there is Equipercentile, which is mostly used for equating forms but can similarly be used for scaling. In this conversion, we match the percentile for each, even if it is a very nonlinear transformation. For example, suppose our Form A had a 90th percentile of 46, which became a scale of 384. We find that Form B has a 90th percentile at 44 points, so we call that a scaled score of 384, and calculate a similar conversion for all other points.
Why are we doing this again?
Well, you can kind of see it in the example of having two forms with a difference in difficulty. In the Equipercentile example, suppose there is a cut score to be in the top 10% to win a scholarship. If you get 45 on Form A you will lose, but if you get 45 on Form B you will win. Test sponsors don’t want to have this conversation with angry examinees, so they convert all scores to an arbitrary scale. The 90th percentile is always a 384, no matter how hard the test is. (Yes, that simple example assumes the populations are the same… there’s an entire portion of psychometric research dedicated to performing stronger equating.)
How do we implement scaled scoring?
Some transformations are easily done in a spreadsheet, but any good online assessment platform should handle this topic for you. Here’s an example screenshot from our software.

Nathan Thompson earned his PhD in Psychometrics from the University of Minnesota, with a focus on computerized adaptive testing. His undergraduate degree was from Luther College with a triple major of Mathematics, Psychology, and Latin. He is primarily interested in the use of AI and software automation to augment and replace the work done by psychometricians, which has provided extensive experience in software design and programming. Dr. Thompson has published over 100 journal articles and conference presentations, but his favorite remains https://scholarworks.umass.edu/pare/vol16/iss1/1/ .
