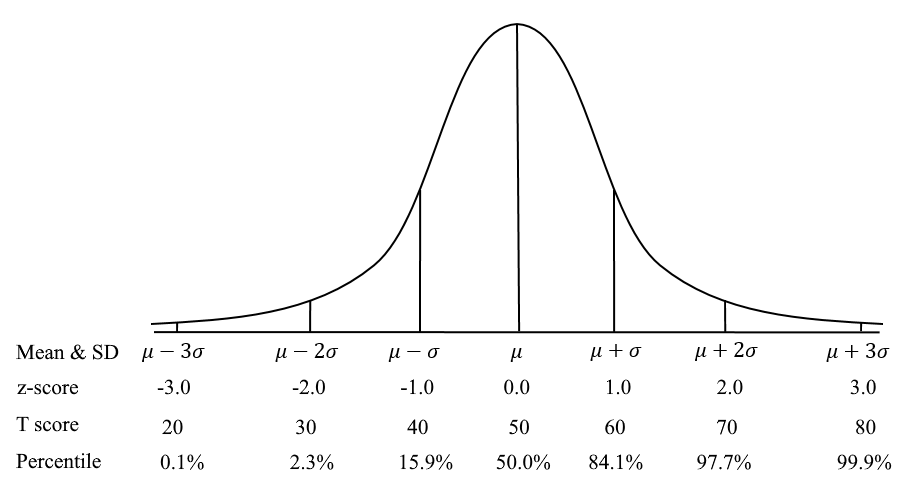
A T Score is a conversion of scores on a test to a standardized scale with a mean of 50 and standard deviation of 10. This is a common example of a scaled score in psychometrics and assessment. A scaled score is simply a way to present scores in a more meaningful and easier-to-digest context, especially across different types of assessment. Therefore, a T Score is a standardized way that scores are presented to make them easier to understand.
Actually, any variable with a normal distribution can be described this way, for example the weight of adult males in the USA. If for example we say the mean is 200 and the standard deviation is 15, we can easily convert to T scores.
Details and examples are below. If you would like to explore the concept on your own, here’s a free tool in Excel that you can download!
What is a T Score?
A T score is a conversion of the standard normal distribution, aka Bell Curve or z-score. The normal distribution places observations (of anything, not just test scores) on a scale that has a mean of 0.00 and a standard deviation of 1.00. We simply convert this to have a mean of 50 and standard deviation of 10. Doing so has two immediate benefits to most consumers:
- There are no negative scores; people generally do not like to receive a negative score!
- Scores are round numbers that generally range from 0 to 100, depending on whether 3, 4, or 5 standard deviations is the bound (usually 20 to 80); this somewhat fits with what most people expect from their school days, even though the numbers are entirely different.
The image below shows the normal distribution, labeled with the different scales for interpretation.

How do I calculate a T score?
Use this formula:
T = z*10 + 50
where z is the standard z-score on the normal distribution N(0,1).
Of course, if you have raw scores such as number-correct, you need to first convert them to T scores.
Example of a T score
Suppose you have a z-score of -0.5. If you put that into the formula, you get T = -0.5*10 + 50 = -5 + 50 = 45. If you look at the graphic above, you can see how being half a standard deviation below the mean translates to a T score of 45.
How to interpret a T score?
As you can see above, a T Score of 40 means that you are approximately the 16th percentile. This is a low score, obviously, but a student will feel better than if they received a score if -1. It is for the same reason that many educational assessments use other scaled scores. The SAT has a scale of mean=500 SD=100 (T score x 10), so if you receive a score of 400 it again means that you are z=-1 or percentile of 16.

A 70 means that you are approximately the 98th percentile – so that it is actually quite high though students who are used to receiving 90s will feel like it is low!
Since there is a 1-to-1 mapping of T Score to the other rows, you can see that it does not actually provide any new information. It is simply a conversion to round, positive numbers, that is easier to digest and less likely to upset someone that is unfamiliar with psychometrics. My undergraduate professor who introduced me to psychometrics used the term “repackaging” to describe scaled scores. Like if you take an object out of one box and put it in a different box, it looks different superficially, but the object itself and its meaning (e.g., weight) have not changed.
Is a T Score like a t-test?
No. Couldn’t be more unrelated. Nothing like the t-test.
How do I implement with an assessment?
If you are using off-the-shelf psychological assessments, they will likely produce a T Score or other scaled score for you in the results. If you want to utilize it for your own assessments, you need a world-class assessment platform like Assess.ai that has strong functionality for scoring methods and scaled scoring. An example of this is below. Here, we are utilizing item response theory for the raw score.
As with all scaled scoring, it is a good idea to provide an explanation to your examinees and stakeholders. You will need text on your score report, handbook, or website which explains how the test is scored so that users can understand and interpret their T scores.

Nathan Thompson earned his PhD in Psychometrics from the University of Minnesota, with a focus on computerized adaptive testing. His undergraduate degree was from Luther College with a triple major of Mathematics, Psychology, and Latin. He is primarily interested in the use of AI and software automation to augment and replace the work done by psychometricians, which has provided extensive experience in software design and programming. Dr. Thompson has published over 100 journal articles and conference presentations, but his favorite remains https://scholarworks.umass.edu/pare/vol16/iss1/1/ .
