What is a z-score?
A z-score measures the distance between a raw score and a mean in standard deviation units. The z-score is also known as a standard score since it enables comparing scores on various variables by standardizing the distribution of scores. It is worth mentioning that a standard normal distribution (also known as the z-score distribution or probability distribution) is a normally shaped distribution with a mean of 0 and a standard deviation of 1. T-score is another example of standardized scores.
The z-score can be positive or negative. The sign depends on whether the observation is above or below the mean. For instance, the z of +2 indicates that the raw score (data point) is two standard deviations above the mean, while a -1 signifies that it is one standard deviation below the mean. The z of 0 equals the mean. Z-scores generally range from -3 standard deviations (which would fall to the far left of the normal distribution curve) up to +3 standard deviations (which would fall to the far right of the normal distribution curve). This covers 99% of the population; there are people outside that range (e.g., gifted students) but for most cases it is difficult to measure the extremes and there is little practical difference. It is for this reason that scaled scores on exams are often produced with this paradigm; the SAT has a mean of 500 and standard deviation of 100, so the range is 200 to 800.
How to calculate a z-score
Here is a formula for calculating the z:
z = (x – μ)/σ
where
x – individual value
μ – mean
σ – standard deviation.
Interpretation of the formula:
- Subtract the mean of the values from the individual value
- Divide the difference by the standard deviation.
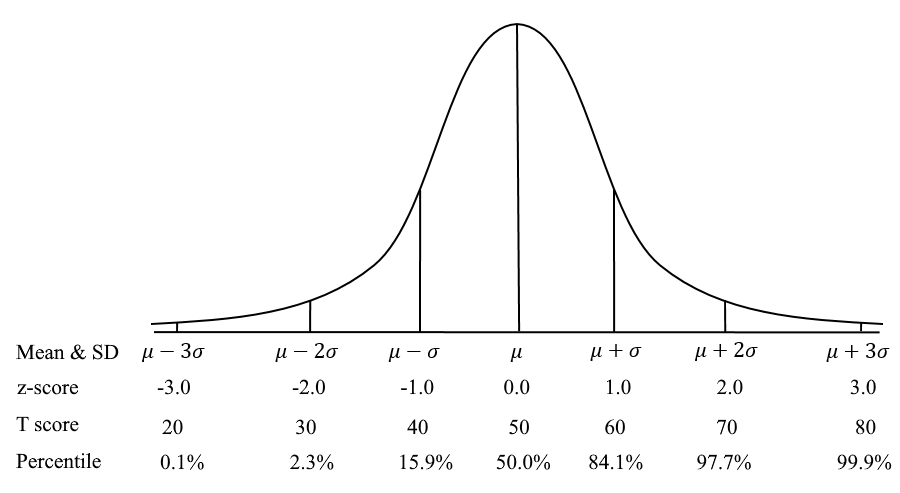
Here is a graphical depiction of the standard normal curve and how the z-score relates to other metrics.
Advantages of using a z-score
When you standardize the raw data by transforming them into z-scores, you receive the following benefits:
- Identify outliers
- Understand where an individual score fits into a distribution
- Normalize scores for statistical decision-making (e.g., grading on a curve)
- Calculate probabilities and percentiles using the standard normal distribution
- Compare scores on different distributions with different means and standard deviations
Example of using a z-score in real life situation
Let’s imagine that there is a set of SAT scores from students, and this data set obeys a normal distribution law with the mean score of 500 and a standard deviation of 100. Suppose we need to find the probability that these SAT scores exceed 650. In order to standardize our data, we have to find the z-score for 650. The z will tell us how many standard deviations away from the mean 650 is.
- Subtracting the mean from the individual value:
x – 650
μ – 500
x – μ = 650– 500= 150
- Dividing the obtained difference by the standard deviation:
σ – 100
z = 150 ÷ 100 = 1.5
The z for the value of 650 is 1.5, i.e. 650 is 1.5 standard deviations above the mean in our distribution.
If you look up this z-score on a conversion table, you will see that it says 0.93319. This means that a score of 650 is at the 93rd percentile of students.
Additional resources
Normal Distribution (Wikipedia)
Laila Issayeva M.Sc.
Latest posts by Laila Issayeva M.Sc. (see all)
- Factor Analysis: Evaluating Dimensionality in Assessment - August 16, 2024
- What is Digital Assessment, aka e-Assessment? - May 18, 2024
- What is a z-score? - November 15, 2023