Psychometrics
Computerized Classification Testing: SPRT, GLRT, and Abraham Wald
Computerized classification testing (CCT) refers to tests or assessments that are delivered to people, obviously via computer, for the purpose of classifying them into groups. Unlike traditional testing, which aims to estimate a student’s ability

Norm-Referenced vs. Criterion-Referenced Testing: Definition and Interpretation
The two terms Norm-Referenced and Criterion-Referenced are commonly used to describe tests, exams, and assessments. They are often some of the first concepts learned when studying assessment and psychometrics. Norm-referenced means that we are referencing how

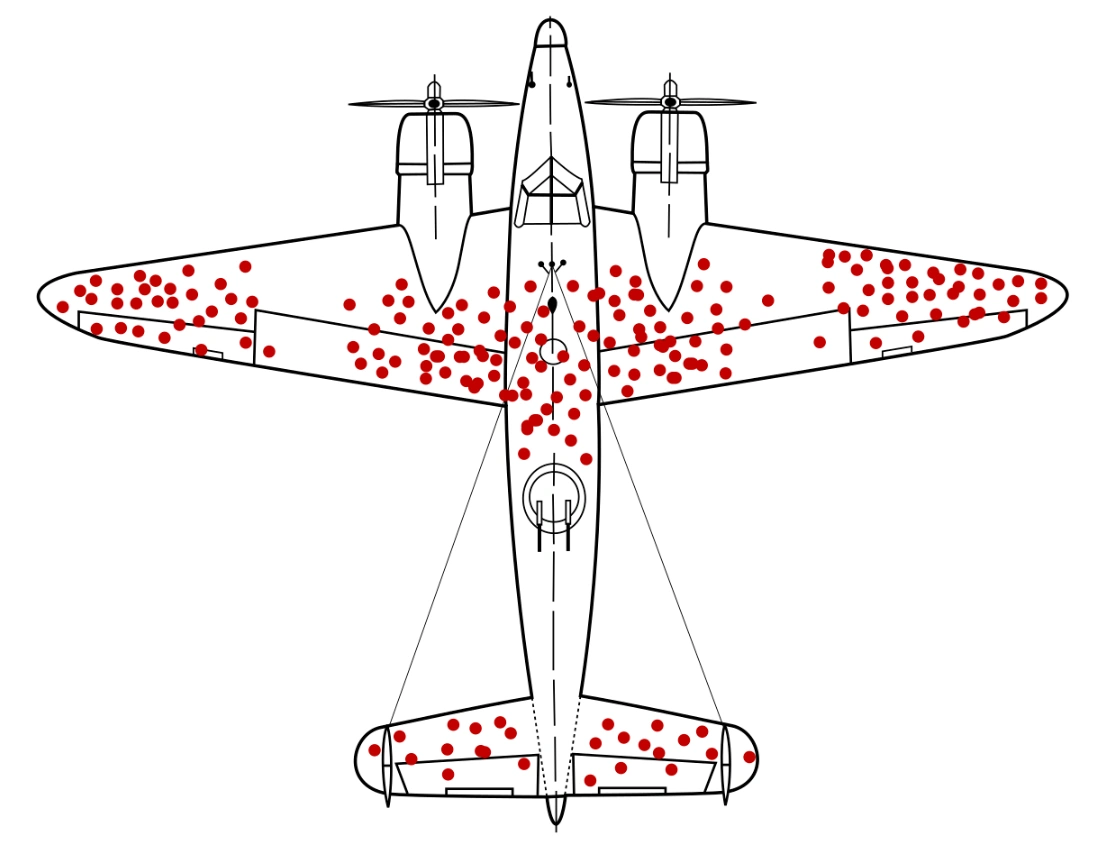
The Story of the Three Standard Errors
One of my graduate school mentors once said in class that there are three standard errors that everyone in the assessment or I/O Psychology field needs to know: the standard error of the mean, the
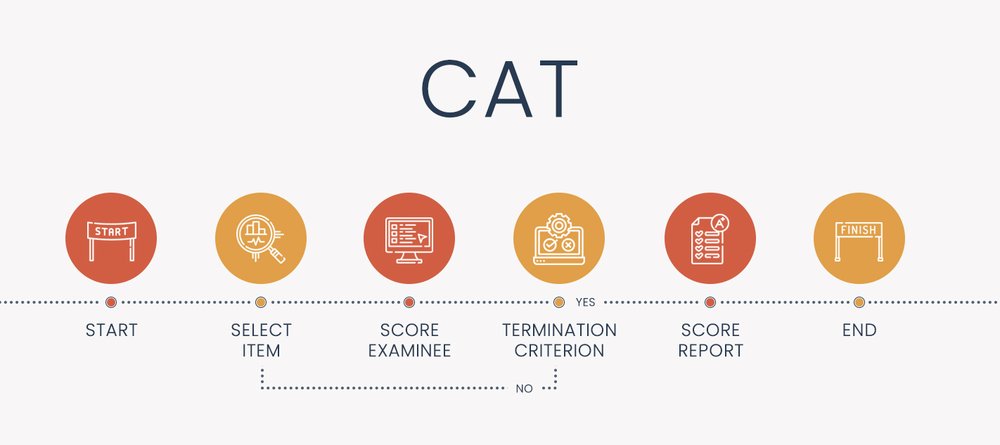
Computerized Adaptive Testing (CAT): Introduction, Examples, Software
Computerized adaptive testing is an AI-based approach to assessment that dynamically personalizes the assessment based on your answers – making the test shorter, more accurate, more secure, more engaging, and fairer. If you do well,

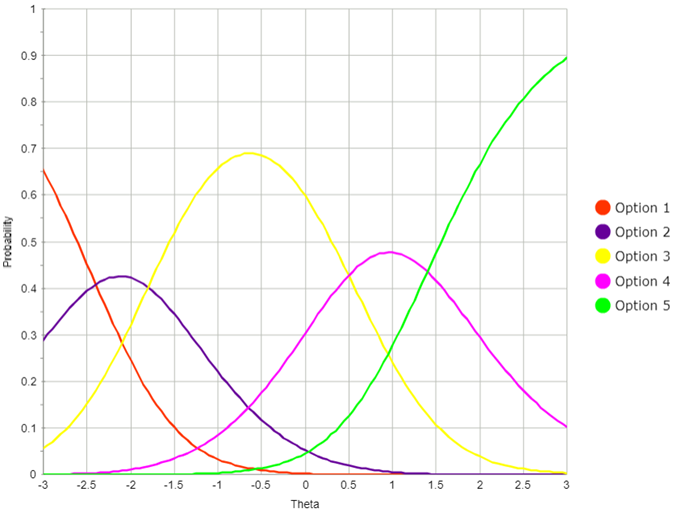
What are Cognitive Diagnostic Models?
What Are Cognitive Diagnostic Models? Cognitive diagnostic models (CDMs) are a psychometric framework designed to enhance how tests are structured and scored. Instead of providing just an overall test score, CDMs aim to generate a

What Should Psychometrics Be Doing?
The Goal: Quality Assessment On March 31, 2017, I read an article in The Industrial-Organizational Psychologist (the journal published by the Society for Industrial Organizational Psychology) that really resonated with me: Has Industrial-Organizational Psychology Lost
Big Data: The Future of Assessment
Assessments have long been a cornerstone of education, hiring, and psychological research. However, with advancements in artificial intelligence and machine learning, these assessments are evolving faster than ever. Moreover, Big Data is revolutionizing how we
What is a rubric?
What is a Rubric? A rubric is a set of rules for converting unstructured responses on assessments—such as essays—into structured data that can be analyzed psychometrically. It helps educators evaluate qualitative work consistently and fairly.

Time Limits in Assessment
Time limits are an essential parameter to just about every type of assessment. A time limit is the length of time given to individuals to complete their assessment or a defined portion of it. Managing
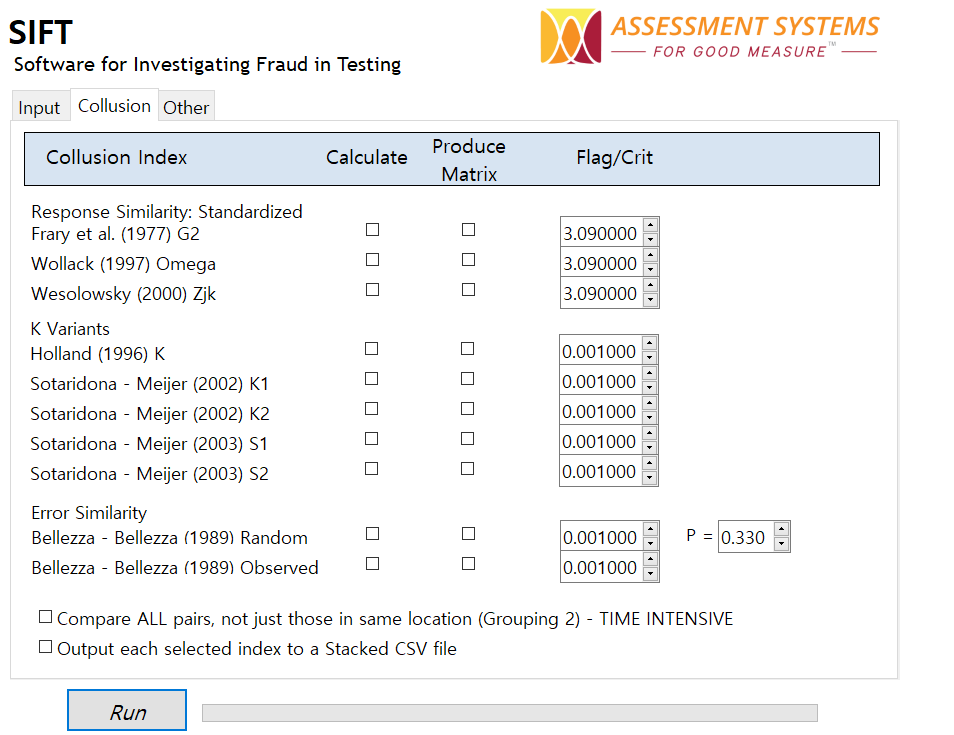
SIFT: A new tool for detection of test fraud
Introduction Test fraud is an extremely common occurrence. We’ve all seen articles about examinee cheating. However, there are very few defensible tools to help detect it. I once saw a webinar from an online testing

What is a KSAO, and how does it impact assessment?
KSAOs (Knowledge, Skills, Abilities, and Other Characteristics) is an approach to defining the human attributes necessary for success on a job. It is an essential aspect of human resources and organizational development field, impacting critical

Summative vs Formative Assessment in Education
Summative and formative assessment are a crucial component of the educational process. If you work in the educational assessment field or even in educational generally, you have probably encountered these terms. What do they mean?
Situational Judgment Tests: Higher Fidelity in Pre-Employment Testing
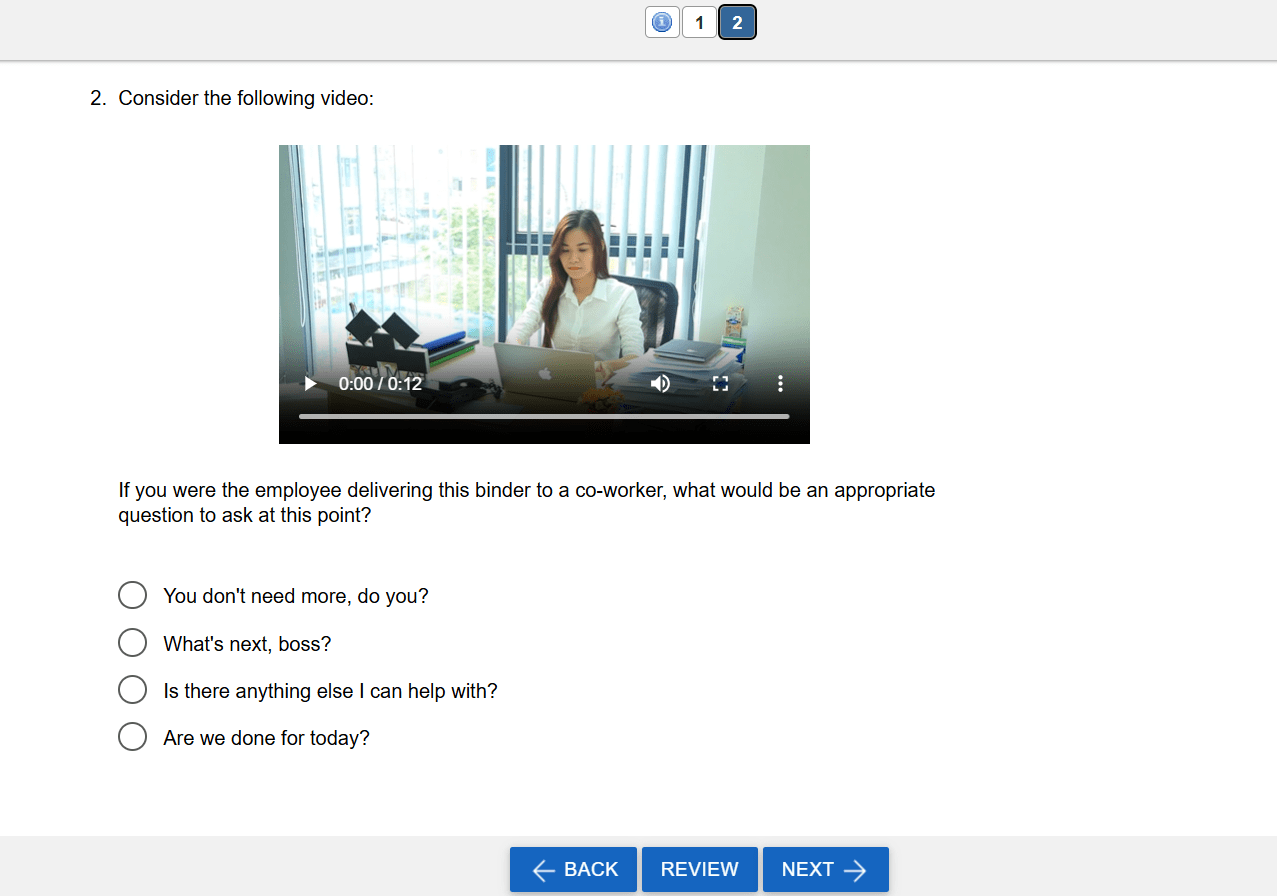
Situational judgment tests (SJTs) are a type of assessment typically used in a pre-employment context to assess candidates’ soft skills and decision-making abilities. As the name suggests, we are not trying to assess something like

Confidence Intervals in Assessment and Psychometrics
Confidence intervals (CIs) are a fundamental concept in statistics, used extensively in assessment and measurement to estimate the reliability and precision of data. Whether in scientific research, business analytics, or health studies, confidence intervals provide

General Intelligence and Its Role in Assessment and Measurement
General intelligence, often symbolized as “g,” is a concept that has been central to psychology and cognitive science since the early 20th century. First introduced by Charles Spearman, general intelligence represents an individual’s overall cognitive

Big Five Personality Traits: A Foundation for Modern Assessments
Personality plays a crucial role in shaping our behaviors, attitudes, and overall interactions with the world. One of the most widely accepted frameworks for understanding personality is the Big Five Personality Traits model—also known as

BYOD in Assessment: Enhancing Learning with Personal Devices
The introduction of Bring Your Own Device (BYOD) policies by academic institutions has led to significant changes in education, particularly in the context of assessments. These policies permit students to bring and use their personal

Bloom’s Taxonomy and Cognitive Levels in Assessment: A Key to Effective Testing
Bloom’s Taxonomy is a hierarchical classification of cognitive levels ranging from lower to higher order thinking, which provides a valuable framework for test development. The development of effective assessments is a cornerstone of educational practice,