
Split Half Reliability is an internal consistency approach to quantifying the reliability of a test, in the paradigm of classical test theory. Reliability refers to the repeatability or consistency of the test scores; we definitely want a test to be reliable. The name comes from a simple description of the method: we split the test into two halves, calculate the score on each half for each examinee, then correlate those two columns of numbers. If the two halves measure the same thing, then the correlation is high, indicating a decent level of unidimensionality in the construct and reliability in measuring the construct.
Why do we need to estimate reliability? Well, it is one of the easiest ways to quantify the quality of the test. Some would argue, in fact, that it is a gross oversimplification. However, because it is so convenient, classical indices of reliability are incredibly popular. The most popular is coefficient alpha, which is a competitor to split half reliability.
How to Calculate Split Half Reliability
The process is simple.
- Take the test and split it in half
- Calculate the score of each examinee on each half
- Correlate the scores on the two halves
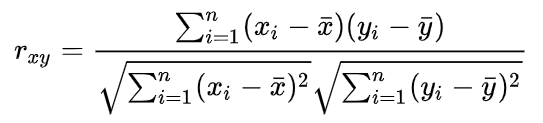
The correlation is best done with the standard Pearson correlation.
This, of course, begs the question: How do we split the test into two halves? There are so many ways. Well, psychometricians generally recommend three ways:
- First half vs last half
- Odd-numbered items vs even-numbered items
- Random split
You can do these manually with your matrix of data, but good psychometric software will for these for you, and more (see screenshot below).
Example
Suppose this is our data set, and we want to calculate split half reliability.
| Person | Item1 | Item2 | Item3 | Item4 | Item5 | Item6 | Score |
| 1 | 1 | 0 | 0 | 0 | 0 | 0 | 1 |
| 2 | 1 | 0 | 1 | 0 | 0 | 0 | 2 |
| 3 | 1 | 1 | 0 | 1 | 0 | 0 | 3 |
| 4 | 1 | 0 | 1 | 1 | 1 | 1 | 5 |
| 5 | 1 | 1 | 0 | 1 | 0 | 1 | 4 |
Let’s split it by first half and last half. Here are the scores.
| Score 1 | Score 2 |
| 1 | 0 |
| 2 | 0 |
| 2 | 1 |
| 2 | 3 |
| 2 | 2 |
The correlation of these is 0.51.
Now, let’s try odd/even.
| Score 1 | Score 2 |
| 1 | 0 |
| 2 | 0 |
| 1 | 2 |
| 3 | 2 |
| 1 | 3 |
The correlation of these is -0.04! Obviously, the different ways of splitting don’t always agree. Of course, with such a small sample here, we’d expect a wide variation.
Advantages of Split Half Reliability
One advantage is that it is so simple, both conceptually and computationally. It’s easy enough that you can calculate it in Excel if you need to. This also makes it easy to interpret and understand.
Another advantage, which I was taught in grad school, is that split half reliability assumes equivalence of the two halves that you have created; on the other hand, coefficient alpha is based at an item level and assumes equivalence of items. This of course is never the case – but alpha is fairly robust and everyone uses it anyway.
Disadvantages… and the Spearman-Brown Formula
The major disadvantage is that this approach is evaluating half a test. Because tests are more reliable with more items, having fewer items in a measure will reduce its reliability. So if we take a 100 item test and divide it into two 50-item halves, then we are essentially making a quantification of reliability for a 50 item test. This means we are underestimating the reliability of the 100 item test. Fortunately, there is a way to adjust for this. It is called the Spearman-Brown Formula. This simple formula adjusts the correlation back up to what it should be for a 100 item test.
Another disadvantage was mentioned above: the different ways of splitting don’t always agree. Again, fortunately, if you have a larger sample of people or a longer test, the variation is minimal.
OK, how do I actually implement?
Any good psychometric software will provide some estimates of split half reliability. Below is the table of reliability analysis from Iteman. This table actually continues for all subscores on the test as well. You can download Iteman for free at its page and try it yourself.
This test had 100 items and 85 scored items (15 unscored pilot). The alpha was around 0.82, which is acceptable, though it should be higher for 100 items. The results then show for all three split half methods, and then again for the Spearman-Brown (S-B) adjusted version of each. Do they agree with alpha? For the total test, the results don’t jive for two of the three methods. But for the Scored Items, the three S-B calculations align with the alpha value. This is most likely because some of the 15 pilot items were actually quite bad. In fact, note that the alpha for 85 items is higher than for 100 items – which says the 15 new items were actually hurting the test!
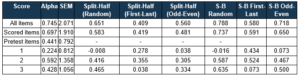
This is a good example of using alpha and split half reliability together. We made an important conclusion about the exam and its items, merely by looking at this table. Next, the researcher should evaluate those items, usually with P value difficulty and point-biserial discrimination.

Nathan Thompson earned his PhD in Psychometrics from the University of Minnesota, with a focus on computerized adaptive testing. His undergraduate degree was from Luther College with a triple major of Mathematics, Psychology, and Latin. He is primarily interested in the use of AI and software automation to augment and replace the work done by psychometricians, which has provided extensive experience in software design and programming. Dr. Thompson has published over 100 journal articles and conference presentations, but his favorite remains https://scholarworks.umass.edu/pare/vol16/iss1/1/ .