
Test Response Function in Item Response Theory
The Test Response Function (TRF) in item response theory (IRT) is a mathematical function that describes the relationship between the latent trait that a test is measuring, which psychometricians call theta (θ), and the predicted raw score on the test in a traditional notion (percentage/proportion/number correct). An important concept from IRT, it provides a way to evaluate the performance of the test, as well as other aspects such as relative difficulty. In addition, it has more advanced usages, such as being used for some approaches to IRT equating.
What is the Test Response Function in IRT?
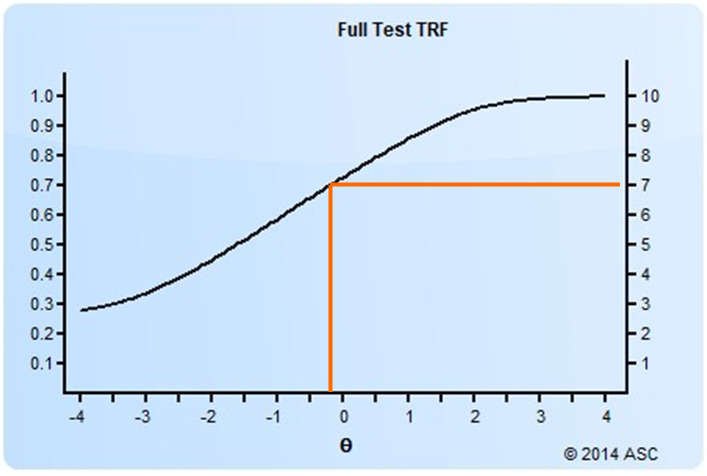
The test response function is a logistic-shaped curve like you see below. This is an example of a test with 10 dichotomous items. It tells us that a person with a theta of -0.30 is likely to get 7 items correct on the test, a proportion of 0.70. Meanwhile, an examinee with a theta of +2.0 is expected to get about 9.5 items correct on average. You can see how this provides some conceptual linkage between item response theory and classical test theory.
How do we determine the Test Response Function?
The test response function is obtained by summing the item response functions from all items in the test. Each item response function has a logistic shape as well, but the y-axis is the probability of getting a certain item correct and therefore ranges 0.0 to 1.0. So if you add these over 10 items, the raw range is then 0 to 10, as you see above.
Here is a brief example. Suppose you have a test of 5 items with the following IRT parameters.
| Seq | a | b | c |
| 1 | 0.80 | -2.00 | 0.20 |
| 2 | 1.00 | -1.00 | 0.00 |
| 3 | 0.70 | 0.00 | 0.25 |
| 4 | 1.20 | 0.00 | 0.25 |
| 5 | 1.10 | 1.00 | 0.20 |
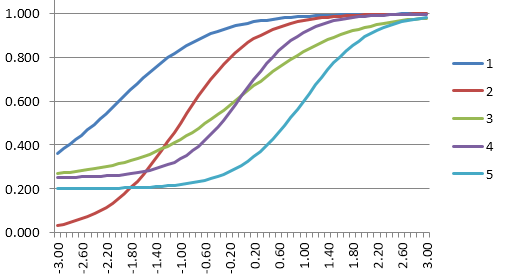
The item response functions for these look like the graphic below. The dark blue line is the easiest item, and the light blue line is the hardest item.
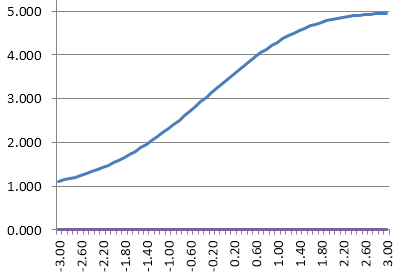
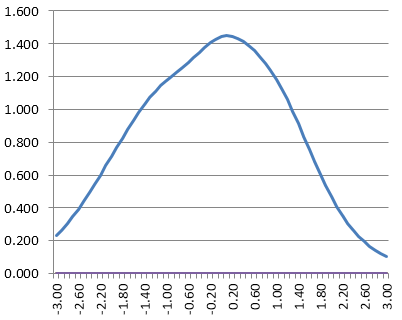
If you sum up those IRFs, you would obtain this as the test response function. Note that the y-axis is now 5, because we have summed five 1-point items. It is telling us that a theta of -1.40 will likely get 2 items correct, and 0.60 get 4 items correct.
For completeness, also note that we can take the item information functions…
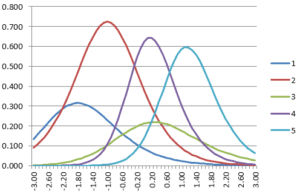
…and sum them into the Test Information Function (see here for an article on that).
And that can be inverted into a conditional standard error of measurement function:
Note how these are all a function of each other, which is one of the strengths of item response theory. The last two are clearly an inverse of each other. The test response function is a function of the test information function if you consider the derivative. The TIF is a function of the derivative of the TRF, and therefore the TIF is highest where the TRF has the highest slope. The TRF usually has a high slope in the middle and less slope on the ends, so the TIF ends up being shaped like a mountain.
How can we use this to solve measurement issues?
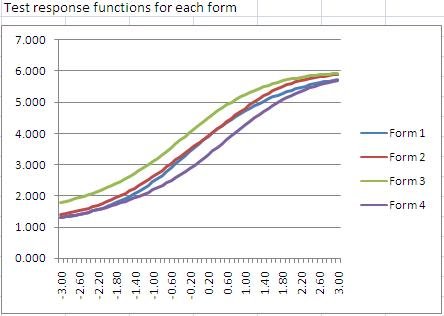
The test response function can be used to compare different test forms. The image below is from our Form Building Tool, and shows 4 test forms together. Form 3 is the easiest from a classical perspective, because it is higher than the rest for a given theta. That is, at a theta of 0.0, the expected score is 4.5, compared to 3.5 on forms 1 and 2, and 3.0 on Form 4. However, if you are scoring examinees with IRT, the actual form does not matter – such an examinee will receive a theta of 0.0 regardless of the form they take. (This won’t be exact for a test of 6 items… but for a test of 100 items it would work out.)
An important topic in psychometrics is Linking and Equating, that is, trying to determine comparable scores on different test forms. Two important methods for this, Stocking-Lord and Haebara, utilize the test response function in their calculations.
Generalizing the TRF to CAT and LOFT
Note that the TRF can be adapted by reconceptualizing the y-axis. Suppose we have a pool of 100 items and everyone will randomly receive 50, which is a form of linear on the fly testing (LOFT). The test response function with the scale of 0 to 100 is not as useful, but we can take the proportion scale and use that to predict raw scores out of 50 items, with some allowance for random variation. Of course, we could also use the actual 50 items that a given person saw to calculate the test response function for them. This could be compared across examinees to evaluate how equivalent the test forms are across examinees. In fact, some LOFT algorithms seek to maximize the equivalence of TRFs/TIFs across examinees rather than randomly selecting 50 items. The same can be said for computerized adaptive testing (CAT), but the number of items can vary between examinees with CAT.
OK, how do I actually apply this?
You will need software that can perform IRT calibrations, assemble test forms with IRT, and deliver tests that are scored with IRT. We provide all of this. Contact us to learn more.
Nathan Thompson, PhD
Latest posts by Nathan Thompson, PhD (see all)
- Psychometrics: Data Science for Assessment - June 5, 2024
- Setting a Cutscore to Item Response Theory - June 2, 2024
- What are technology enhanced items? - May 31, 2024