Classical Test Theory: Item Statistics
Classical Test Theory (CTT) is a psychometric approach to analyzing, improving, scoring, and validating assessments. It is based on relatively simple concepts, such as averages, proportions, and correlations. One of the most frequently used aspects is item statistics, which provide insight into how an individual test question is performing. Is it too easy, too hard, too confusing, miskeyed, or potentially another issue? Item statistics are what tell you these things.
What are classical test theory item statistics?
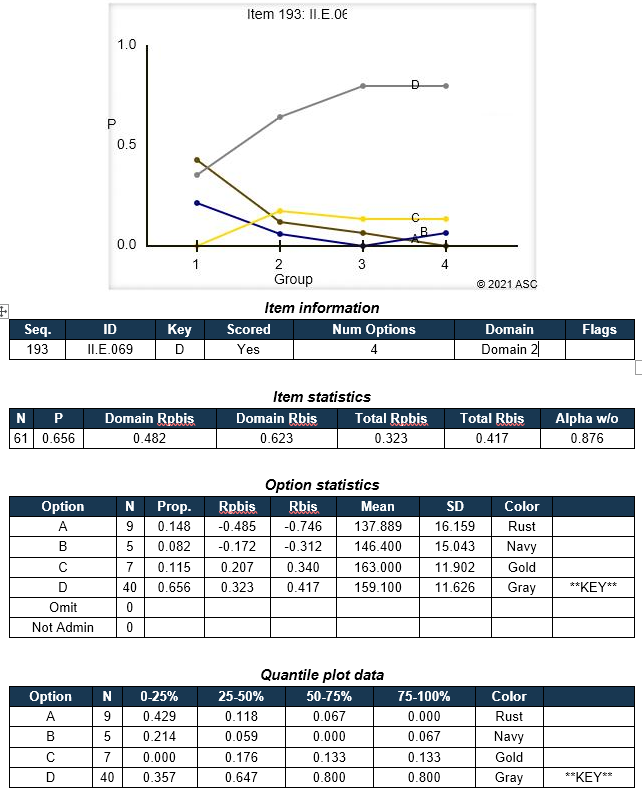
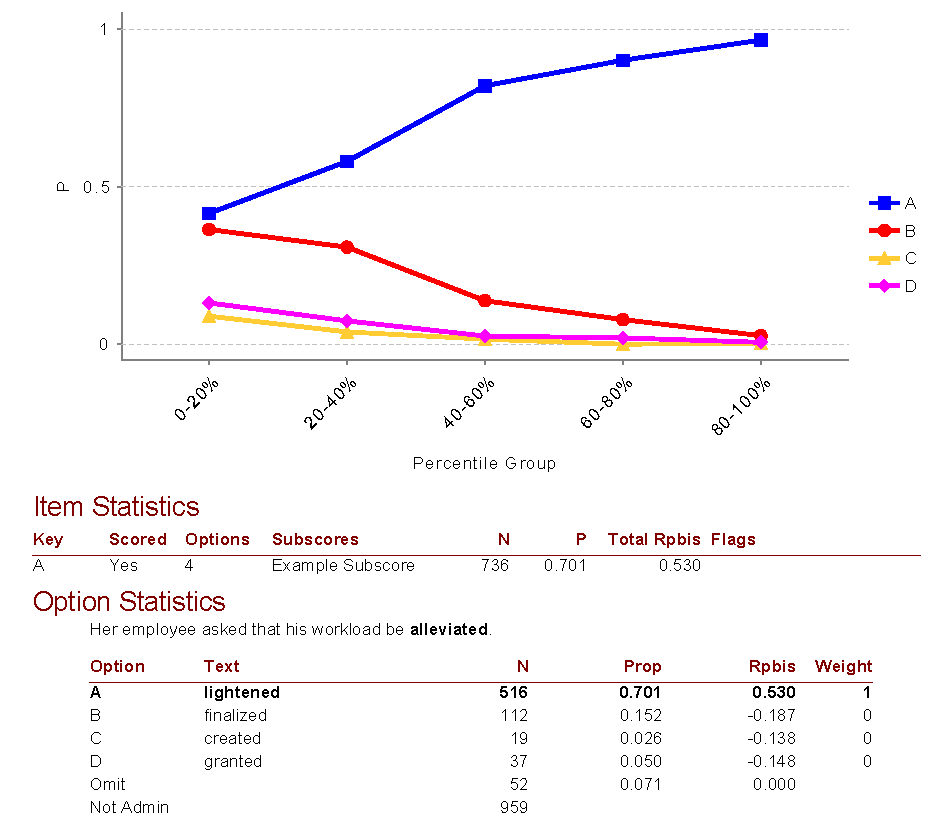
They are indices of how a test item, or components of it, is performing. Items can be hard vs easy, strong vs weak, and other important aspects. Below is the output from the Iteman report in our FastTest online assessment platform, showing an English vocabulary item with real student data. How do we interpret this?
Interpreting Classical Test Theory Item Statistics: Item Difficulty
The P value (Multiple Choice)
The P value is the classical test theory index of difficulty, and is the proportion of examinees that answered an item correctly (or in the keyed direction). It ranges from 0.0 to 1.0. A high value means that the item is easy, and a low value means that the item is difficult. There are no hard and fast rules because interpretation can vary widely for different situations. For example, a test given at the beginning of the school year would be expected to have low statistics since the students have not yet been taught the material. On the other hand, a professional certification exam, where someone can not even sit unless they have 3 years of experience and a relevant degree, might have all items appear easy even though they are quite advanced topics! Here are some general guidelines”
0.95-1.0 = Too easy (not doing much good to differentiate examinees, which is really the purpose of assessment)
0.60-0.95 = Typical
0.40-0.60 = Hard
<0.40 = Too hard (consider that a 4 option multiple choice has a 25% chance of pure guessing)
With Iteman, you can set bounds to automatically flag items. The minimum P value bound represents what you consider the cut point for an item being too difficult. For a relatively easy test, you might specify 0.50 as a minimum, which means that 50% of the examinees have answered the item correctly.
For a test where we expect examinees to perform poorly, the minimum might be lowered to 0.4 or even 0.3. The minimum should take into account the possibility of guessing; if the item is multiple-choice with four options, there is a 25% chance of randomly guessing the answer, so the minimum should probably not be 0.20. The maximum P value represents the cut point for what you consider to be an item that is too easy. The primary consideration here is that if an item is so easy that nearly everyone gets it correct, it is not providing much information about the examinees.
In fact, items with a P of 0.95 or higher typically have very poor point-biserial correlations.
The Item Mean (Polytomous)
This refers to an item that is scored with 2 or more point levels, like an essay scored on a 0-4 point rubric or a Likert-type item that is “Rate on a scale of 1 to 5.”
- 1=Strongly Disagree
- 2=Disagree
- 3=Neutral
- 4=Agree
- 5=Strongly Agree
The item mean is the average of the item responses converted to numeric values across all examinees. The range of the item mean is dependent on the number of categories and whether the item responses begin at 0. The interpretation of the item mean depends on the type of item (rating scale or partial credit). A good rating scale item will have an item mean close to ½ of the maximum, as this means that on average, examinees are not endorsing categories near the extremes of the continuum.
You will have to adjust for your own situation, but here is an example for the 5-point Likert-style item.
1-2 is very low; people disagree fairly strongly on average
2-3 is low to neutral; people tend to disagree on average
3-4 is neutral to high; people tend to agree on average
4-5 is very high; people agree fairly strongly on average
Iteman also provides flagging bounds for this statistic. The minimum item mean bound represents what you consider the cut point for the item mean being too low. The maximum item mean bound represents what you consider the cut point for the item mean being too high.
The number of categories for the items must be considered when setting the bounds of the minimum/maximum values. This is important as all items of a certain type (e.g., 3-category) might be flagged.
Interpreting Classical Test Theory Item Statistics: Item Discrimination
Multiple-Choice Items
The Pearson point-biserial correlation (r-pbis) is a classical test theory measure of the discrimination or differentiating strength, of the item. It ranges from −1.0 to 1.0 and is a correlation of item scores and total raw scores. If you consider a scored data matrix (multiple-choice items converted to 0/1 data), this would be the correlation between the item column and a column that is the sum of all item columns for each row (a person’s score).
A good item is able to differentiate between examinees of high and low ability yet have a higher point-biserial, but rarely above 0.50. A negative point-biserial is indicative of a very poor item because it means that the high-ability examinees are answering incorrectly, while the low-ability examinees are answering it correctly, which of course would be bizarre, and therefore typically indicates that the specified correct answer is actually wrong. A point-biserial of 0.0 provides no differentiation between low-scoring and high-scoring examinees, essentially random “noise.” Here are some general guidelines on interpretation. Note that these assume a decent sample size; if you only have a small number of examinees, many item statistics will be flagged!
0.20+ = Good item; smarter examinees tend to get the item correct
0.10-0.20 = OK item; but probably review it
0.0-0.10 = Marginal item quality; should probably be revised or replaced
<0.0 = Terrible item; replace it
***Major red flag is if the correct answer has a negative Rpbis and a distractor has a positive Rpbis
The minimum item-total correlation bound represents the lowest discrimination you are willing to accept. This is typically a small positive number, like 0.10 or 0.20. If your sample size is small, it could possibly be reduced. The maximum item-total correlation bound is almost always 1.0, because it is typically desired that the r-pbis be as high as possible.
The biserial correlation is also a measure of the discrimination or differentiating strength, of the item. It ranges from −1.0 to 1.0. The biserial correlation is computed between the item and total score as if the item was a continuous measure of the trait. Since the biserial is an estimate of Pearson’s r it will be larger in absolute magnitude than the corresponding point-biserial.
The biserial makes the stricter assumption that the score distribution is normal. The biserial correlation is not recommended for traits where the score distribution is known to be non-normal (e.g., pathology).
Polytomous Items
The Pearson’s r correlation is the product-moment correlation between the item responses (as numeric values) and total score. It ranges from −1.0 to 1.0. The r correlation indexes the linear relationship between item score and total score and assumes that the item responses for an item form a continuous variable. The r correlation and the r-pbis are equivalent for a 2-category item, so guidelines for interpretation remain unchanged.
The minimum item-total correlation bound represents the lowest discrimination you are willing to accept. Since the typical r correlation (0.5) will be larger than the typical rpbis (0.3) correlation, you may wish to set the lower bound higher for a test with polytomous items (0.2 to 0.3). If your sample size is small, it could possibly be reduced. The maximum item-total correlation bound is almost always 1.0, because it is typically desired that the r-pbis be as high as possible.
The eta coefficient is an additional index of discrimination computed using an analysis of variance with the item response as the independent variable and total score as the dependent variable. The eta coefficient is the ratio of the between-groups sum of squares to the total sum of squares and has a range of 0 to 1. The eta coefficient does not assume that the item responses are continuous and also does not assume a linear relationship between the item response and total score.
As a result, the eta coefficient will always be equal or greater than Pearson’s r. Note that the biserial correlation will be reported if the item has only 2 categories.
Nathan Thompson, PhD
Latest posts by Nathan Thompson, PhD (see all)
- What is an Assessment-Based Certificate? - October 12, 2024
- What is Psychometrics? How does it improve assessment? - October 12, 2024
- What is RIASEC Assessment? - September 29, 2024