Why PARCC EBSR Items Provide Bad Data
The Partnership for Assessment of Readiness for College and Careers (PARCC) is a consortium of US States working together to develop educational assessments aligned with the Common Core State Standards. This is a daunting task, and PARCC is doing an admirable job, especially with their focus on utilizing technology. However, one of the new item types has a serious psychometric fault that deserves a caveat with regards to scoring and validation.
What is an Evidence-Based Selected-Response (EBSR) question?
The item type is an “Evidence-Based Selected-Response” (PARCC EBSR) item format, commonly called a Part A/B item or Two-Part item. The goal of this format is to delve deeper into student understanding, and award credit for deeper knowledge while minimizing the impact of guessing. This is obviously an appropriate goal for assessment. To do so, the item is presented as two parts to the student, where the first part asks a simple question and the second part asks for supporting evidence to their answer in Part A. Students must answer Part A correctly to receive credit on Part B. As described on the PARCC website:
In order to receive full credit for this item, students must choose two supporting facts that support the adjective chosen for Part A. Unlike tests in the past, students may not guess on Part A and receive credit; they will only receive credit for the details they’ve chosen to support Part A.
How EBSR items are scored
While this makes sense in theory, it leads to problem in data analysis, especially if using Item Response Theory (IRT). Obviously, this violates the fundamental assumption of IRT: local independence (items are not dependent on each other). So when working with a client of mine, we decided to combine it into one multi-point question, which matches the theoretical approach PARCC EBSR items are taking. The goal was to calibrate the item with Muraki’s Generalized Partial Credit Model (GPCM), which is the standard approach used to analyze polytomous items in K12 assessment (learn more here). The GPCM tries to order students based on the points they earn: 0 point students tend to have the lowest ability, 1 point students of moderate ability, and 2 point students are of the highest ability. Should be obvious, right? Nope.
The first thing we noticed was that some point levels had very small sample sizes. Suppose that Part A is 1 point and Part B is 1 point (select two evidence pieces but must get both). Most students will get 0 points or 2 points. Not many will receive 1 point. We thought about it, and realized that the only way to earn 1 point is to guess Part A but select no correct evidence or only select one evidence point. This leads to issues with the GPCM.
Using the Generalized Partial Credit Model
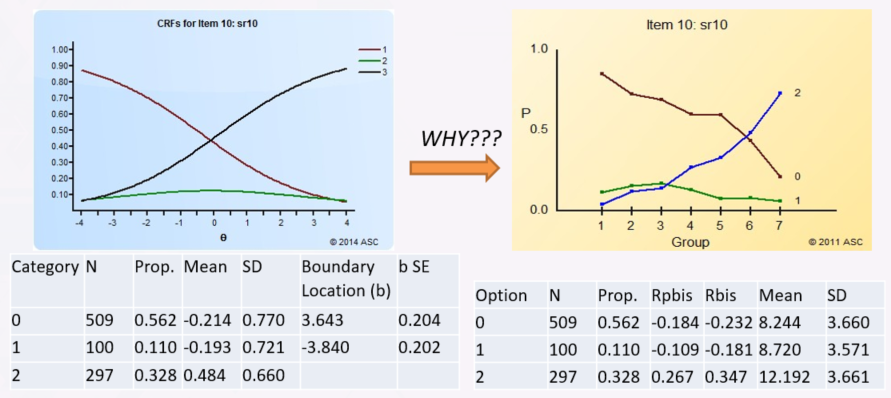
Even when there was sufficient N at each level, we found that the GPCM had terrible fit statistics, meaning that the item was not performing according to the model described above. So I ran Iteman, our classical analysis software, to obtain quantile plots that approximate the polytomous IRFs without imposing the GPCM modeling. I found that in the 0-2 point items tend to have the issue where not many students get 1 point, and moreover the line for them is relatively flat. The GPCM assumes that it is relatively bell-shaped. So the GPCM is looking for where the drop-offs are in the bell shape, crossing with adjacent CRFs – the thresholds – and they aren’t there. The GPCM would blow up, usually not even estimating thresholds in correct ordering.

So I tried to think of this from a test development perspective. How do students get 1 point on these PARCC EBSR items? The only way to do so is to get Part A right but not Part B. Given that Part B is the reason for Part A, this means this group is students who answer Part A correctly but don’t know the reason, which means they are guessing. It is then no surprise that the data for 1-point students is in a flat line – it’s just like the c parameter in the 3PL. So the GPCM will have an extremely tough time estimating threshold parameters.
Why EBSR items don’t work
From a psychometric perspective, point levels are supposed to represent different levels of ability. A 1-point student should be higher ability than a 0-point student on this item, and a 2-point student of higher ability than a 1-point student. This seems obvious and intuitive. But this item, by definition, violates the idea that a 1-point student should have higher ability than a 0-point student. The only way to get 1 point is to guess the first part – and therefore not know the answer and are no different than the 0-point examinees whatsoever. So of course the 1-point results look funky here.
The items were calibrated as two separate dichotomous items rather than one polytomous item, and the statistics turned out much better. This still violates the IRT assumption but at least produces usable IRT parameters that can score students. Nevertheless, I think the scoring of these items needs to be revisited so that the algorithm produces data which is able to be calibrated in IRT.
The entire goal of test items is to provide data points used to measure students; if the Evidence-Based Selected-Response item type is not providing usable data, then it is not worth using, no matter how good it seems in theory!
Nathan Thompson, PhD
Latest posts by Nathan Thompson, PhD (see all)
- What is an Assessment-Based Certificate? - October 12, 2024
- What is Psychometrics? How does it improve assessment? - October 12, 2024
- What is RIASEC Assessment? - September 29, 2024

