Test Development

Why PARCC EBSR Items Provide Bad Data
The Partnership for Assessment of Readiness for College and Careers (PARCC) is a consortium of US States working together to develop educational assessments aligned with the Common Core State Standards. This is a daunting task,

What is Test Scaling?
Scaling is a psychometric term regarding the establishment of a score metric for a test, and it often has two meanings. First, it involves defining the method to operationally scoring the test, establishing an underlying

Intro to the Exam & Test Development Process
The exam and test development cycle the process of building a high-quality assessment in accordance to international standards like NCCA or AERA/APA/NCME, so that it has validity. If there are stakes associated with the test,

Innovation in Assessment: Learning from Other Industries
One of my favorite quotes is from Mark Twain: “There is no such thing as a new idea. It is impossible. We simply take a lot of old ideas and put them into a sort
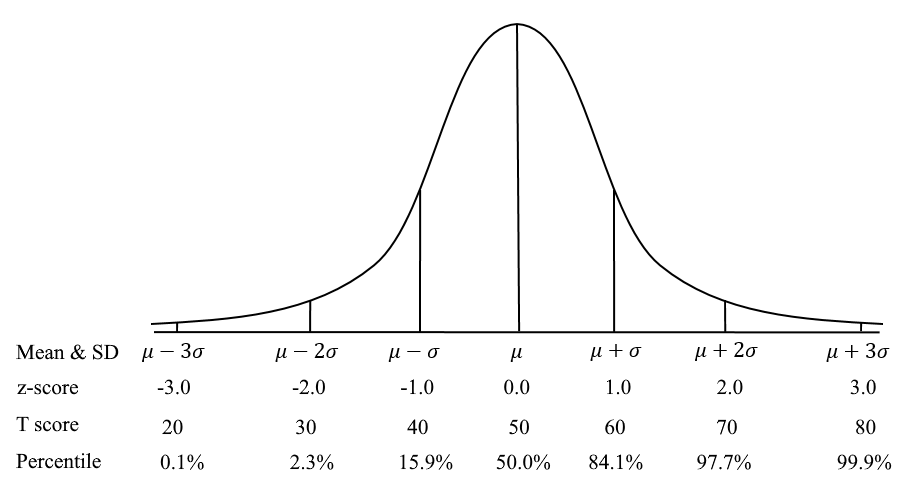
What is a T score in Assessment?
A T Score is a conversion of scores on a test to a standardized scale with a mean of 50 and standard deviation of 10. This is a common example of a scaled score in
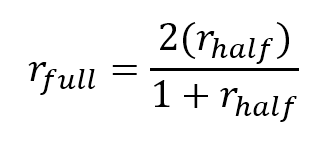
What is the Spearman-Brown formula?
The Spearman-Brown formula, also known as the Spearman-Brown Prophecy Formula or Correction, is a method used in evaluating test reliability. It is based on the idea that split-half reliability has better assumptions than coefficient alpha

Item Writing: Tips for Authoring Better Test Questions
Item writing (aka item authoring) is a science as well as an art, and if you have done it, you know just how challenging it can be! You are experts at what you do, and

Item Review Workflow for Exam Development
Item review is the process of ensuring that newly-written test questions go through a rigorous peer review, to ensure that they are high quality and meet industry standards. What is an item review workflow? Developing

Job Task Analysis Study: Essential for Certification
Job Task Analysis (JTA) is a formal process to define what is being done in a profession, especially what is most important or frequent, and then using this information to make data-driven decisions. It is

Question and Test Interoperability (QTI)
Question and Test Interoperability® (QTI®) is a set of standards around the format of import/export files for test questions in educational assessment and HR/credentialing exams. This facilitates the movement of questions from one software platform
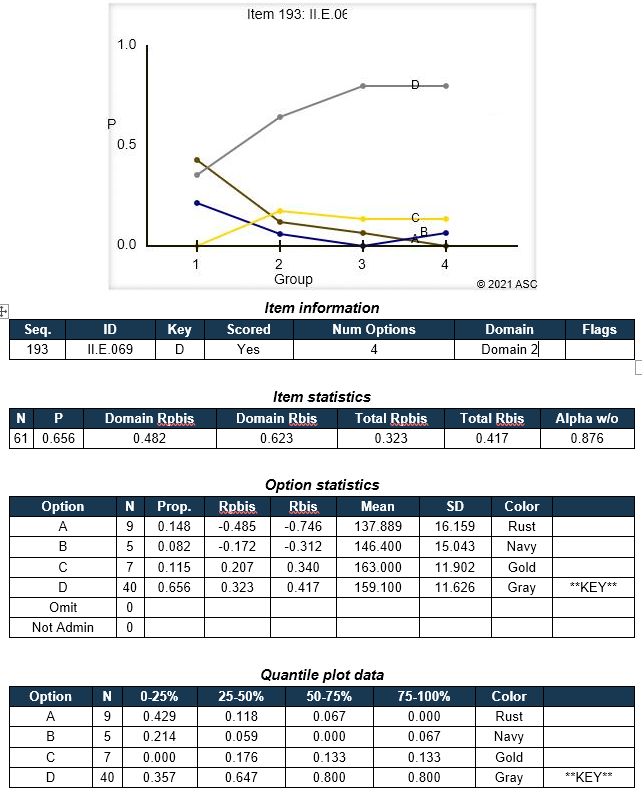
Classical Test Theory: Item Statistics
Classical Test Theory (CTT) is a psychometric approach to analyzing, improving, scoring, and validating assessments. It is based on relatively simple concepts, such as averages, proportions, and correlations. One of the most frequently used aspects

Classical Test Theory vs. Item Response Theory
Classical Test Theory and Item Response Theory (CTT & IRT) are the two primary psychometric paradigms. That is, they are mathematical approaches to how tests are analyzed and scored. They differ quite substantially in substance
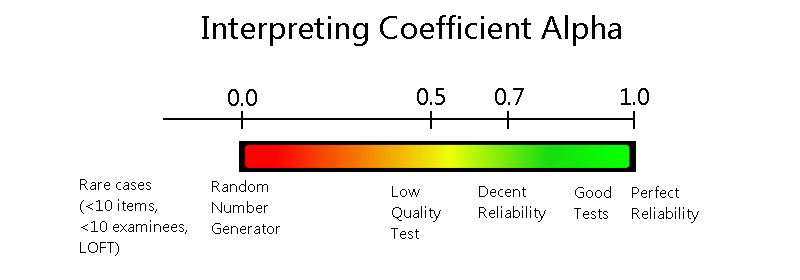
Coefficient Alpha Reliability (Cronbach’s alpha): A Quick Index of Score Consistency
Coefficient alpha reliability, sometimes called Cronbach’s alpha, is a statistical index that is used to evaluate the internal consistency or reliability of an assessment. That is, it quantifies how consistent we can expect scores to

“Dichotomous” Vs “Polytomous” in IRT?
What is the difference between the terms dichotomous and polytomous in psychometrics? Well, these terms represent two subcategories within item response theory (IRT) which is the dominant psychometric paradigm for constructing, scoring and analyzing assessments.

Meta-analysis in Assessment
Meta-analysis is a research process of collating data from multiple independent but similar scientific studies in order to identify common trends and findings by means of statistical methods. To put it simply, it is a

Test validation: How to determine if a test score is supported?
Test validation is the process of verifying whether the specific requirements to test development stages are fulfilled or not, based on solid evidence. In particular, test validation is an ongoing process of developing an argument

Automated Item Generation: Making Test Development More Efficient
Automated item generation (AIG) is a paradigm for developing assessment items (test questions), utilizing principles of artificial intelligence and automation. As the name suggests, it tries to automate some or all of the effort involved

Borderline group method standard setting
The borderline group method of standard setting is one of the most common approaches to establishing a cutscore for an exam. In comparison with the item-centered standard setting methods such as modified-Angoff, Nedelsky, and Ebel,