Item Fit Analysis
Item fit analysis is a type of model-data fit evaluation that is specific to the performance of test items. It is a very useful tool in interpreting and understanding test results, and in evaluating item performance. By implementing any psychometric model, we assume some sort of mathematical function is happening under the hood, and we should check that it is an appropriate function. In classical test theory (CTT), if you use the point-biserial correlation, you are assuming a linear relationship between examinee ability and the probability of a correct answer. If using item response theory (IRT), it is a logistic function. You can evaluate the fit of these using both graphical (visual) and purely quantitative approaches.
Why do item fit analysis?
There are several reasons to do item fit analysis.
- As noted above, if you are assuming some sort of mathematical model, it behooves you to check on whether it is appropriate to even use.
- It can help you choose the model; perhaps you are using the 2PL IRT model and then notice a strong guessing factor (lower asymptote) when evaluating fit.
- Item fit analysis can help identify improper item keying.
- It can help find errors in the item calibration, which determines validity of item parameters.
- Item fit can be used to measure test dimensionality that affects validity of test results (Reise, 1990). For example, if you are trying to run IRT on a single test that is actually two-dimensional, it will likely fit well on one dimension and the other dimension’s items have poor fit.
- Item fit analysis can be beneficial in detecting measured disturbances, such as differential item functioning (DIF).
What is item fit?
Model-data fit, in general, refers to how far away our data is from the predicted values from the model. As such, it is often evaluated with some sort of distance metric, such as a chi-square or a standardized version of it. This easily translates into visual inspection as well.
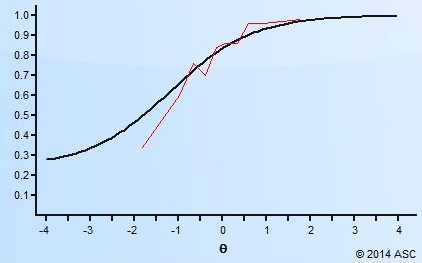
Suppose we took a sample of examinees and divided it up into 10 quantiles. The first is the lowest 10%, then 10-20th percentile, and so on. We graph the proportion in each group that get an item correct. It will be higher proportion for the smarter students. but if it is a small sample, the line might bounce around like the blue line below. When we fit a model like the black line, we can find the total distance of the red lines and it gives us some quantification of how the model is fitting. In some cases, the blue line might be very close to the black, and in others it would not be at all.
Of course, psychometricians turn those values into quantitative indices. Some examples are a Chi-square and a z-Residual, but there are plenty of others. The Chi-square will square the red values and sum them up. The z-Residual takes that and adjusts for sample size then standardizes it onto the familiar z-metric.
Item fit with Item Response Theory
IRT was created in order to overcome most of the limitations that CTT has. Within IRT framework, item and test-taker parameters are independent when test data fit the assumed model. Additionally, these two parameters can be located on one scale, so they are comparable with each other. The independency (invariance) property of IRT makes it possible to solve measurement problems that are almost impossible to get solved within CTT, such as item banking, item bias, test equating, and computerized adaptive testing (Hambleton, Swaminathan, and Rogers, 1991).
There are three logistic models defined and widely used in IRT: one-parameter (1PL), two-parameter (2PL), and three-parameter (3PL). 1PL employs only one parameter, difficulty, to describe the item. 2PL uses two parameters, difficulty and discrimination. 3PL uses three—difficulty, discrimination, and guessing. A successful application of IRT means that test data fit the assumed IRT model. However, it may happen that even when a whole test fits the model, some of the items misfit it, i.e. do not function in the intended manner. Statistically it means that there is a difference between expected and observed frequencies of correct answers to the item at various ability levels.
There are many different reasons for item misfit. For instance, an easy item might not fit the model when low-ability test-takers do not attempt it at all. This usually happens in speeded tests, when there is no penalty for slow work. Next example is when low-ability test-takers answer difficult items correctly by guessing. This usually occurs with the tests consisting of purely multiple-choice items. Another example are the tests that are not unidimensional, then there might be some items that misfit the model.
Examples
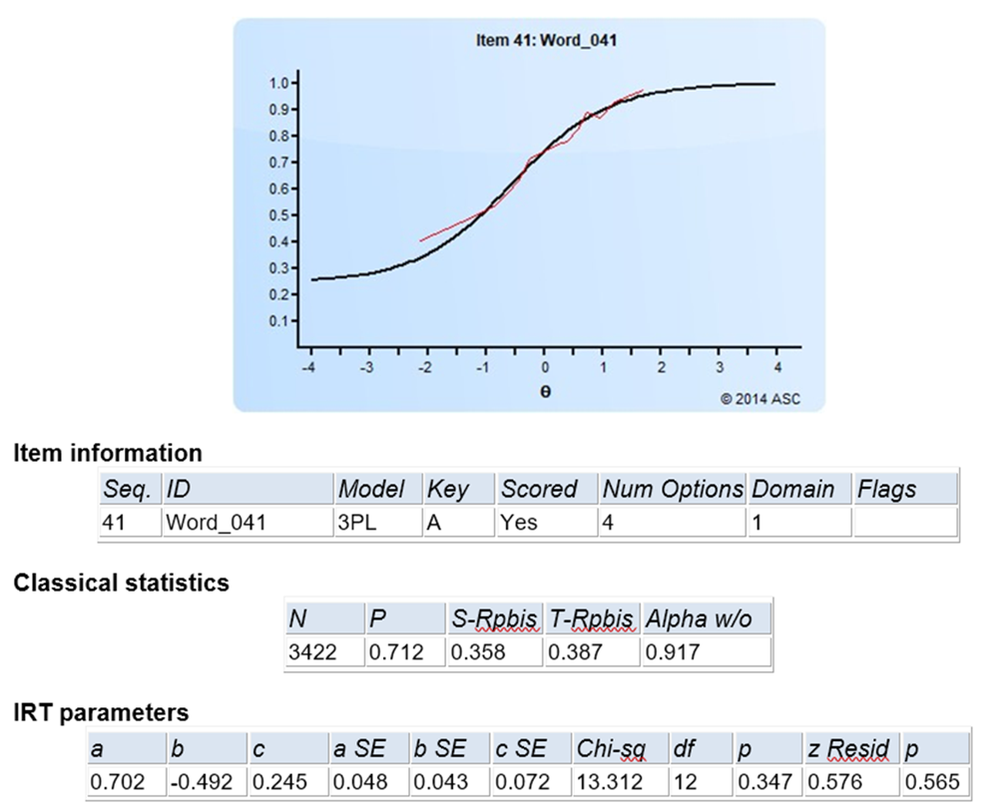
Here are two examples of evaluating item fit with item response theory, using the software Xcalibre. Here is an item with great fit. The red line (observed) is very close to the black line (model). The two fit statistics are Chi-Square and z-Residual. The p-values for both are large, indicating that we are nowhere near rejecting the hypothesis of model fit.
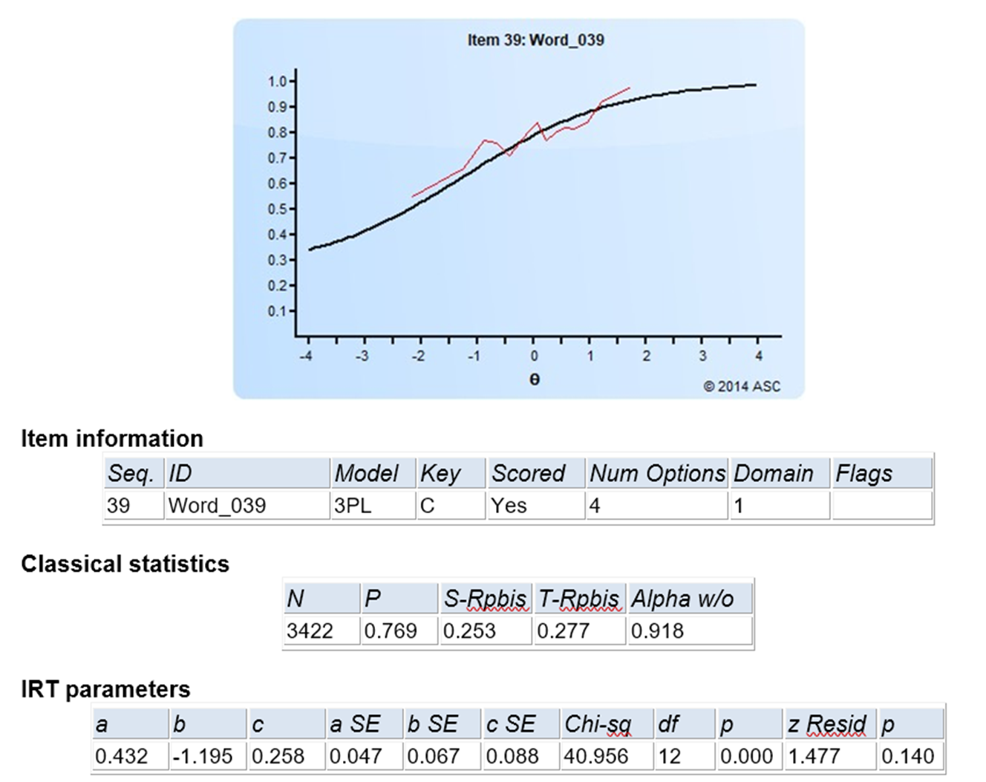
Now, consider the following item. The red line is much more erratic. The Chi-square rejects the model fit hypothesis with p=0.000. The z-Residual, which corrects for sample size, does not reject but is still smaller. This item also has a very low a parameter, so it should probably be evaluate.
Summary
To sum up, item fit analysis is key in item and test development. The relationship between item parameters and item fit identifies factors related to item fitness, which is useful in predicting item performance. In addition, this relationship helps understand, analyze, and interpret test results especially when a test has a significant number of misfit items.
References
Hambleton, R. K., Swaminathan, H., & Rogers, H. J. (1991). Fundamentals of item response theory (Vol. 2). Sage.
Reise, S. P. (1990). A comparison of item-and person-fit methods of assessing model-data fit in IRT. Applied Psychological Measurement, 14(2), 127-137.
Laila Issayeva M.Sc.
Latest posts by Laila Issayeva M.Sc. (see all)
- What is Digital Assessment, aka e-Assessment? - May 18, 2024
- What is a z-score? - November 15, 2023
- Digital Badges - May 29, 2023