Multistage testing algorithm

Multistage testing (MST) is a type of computerized adaptive testing (CAT).  This means it is an exam delivered on computers which dynamically personalize it for each examinee or student.  Typically, this is done with respect to the difficulty of the questions, by making the exam easier for lower-ability students and harder for high-ability students.  Doing this makes the test shorter and more accurate while providing additional benefits.  This post will provide more information on multistage testing so you can evaluate if it is a good fit for your organization.

Already interested in MST and want to implement it?  Contact us to talk to one of our experts and get access to our powerful online assessment platform, where you can create your own MST and CAT exams in a matter of hours.


What is multistage testing?Multistage testing algorithm

Like CAT, multistage testing adapts the difficulty of the items presented to the student. But while adaptive testing works by adapting each item one by one using item response theory (IRT), multistage works in blocks of items.  That is, CAT will deliver one item, score it, pick a new item, score it, pick a new item, etc.  Multistage testing will deliver a block of items, such as 10, score them, then deliver another block of 10.

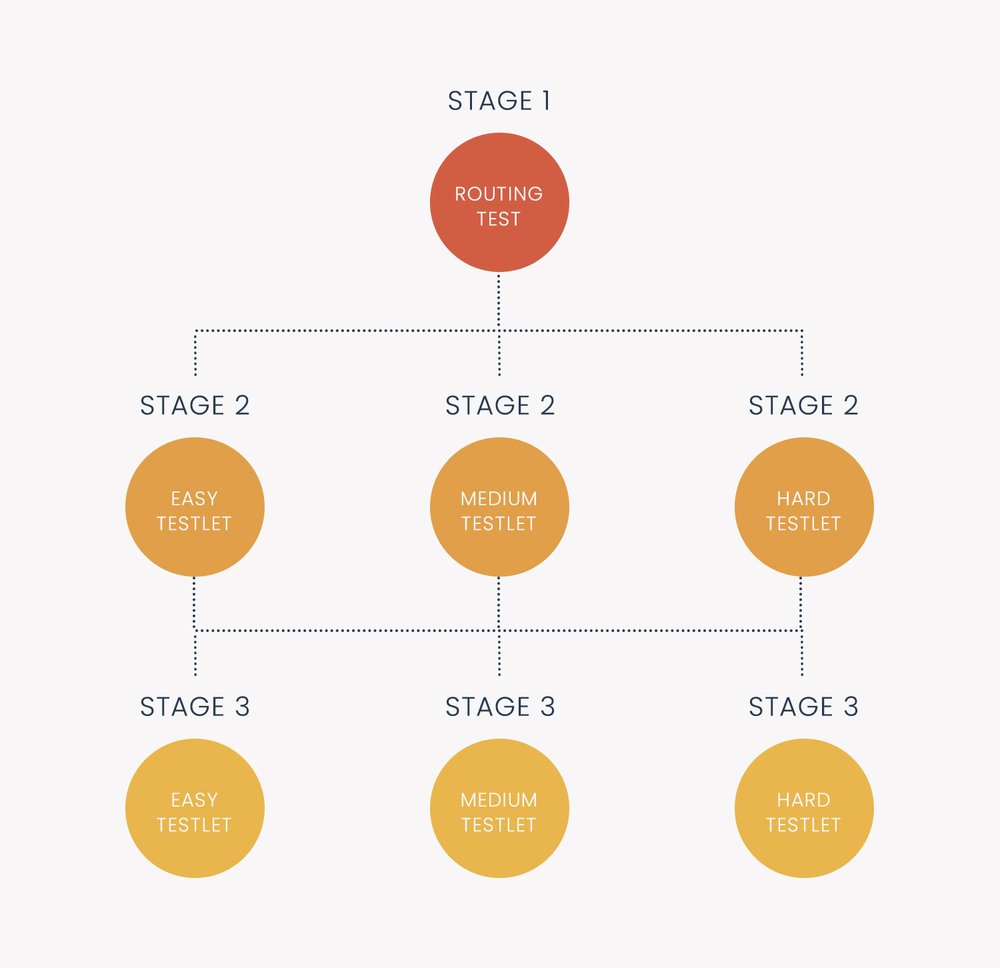
The design of a multistage test is often referred to as panels.  There is usually a single routing test or routing stage which starts the exam, and then students are directed to different levels of panels for subsequent stages.  The number of levels is sometimes used to describe the design; the example on the right is a 1-3-3 design.  Unlike CAT, there are only a few potential paths, unless each stage has a pool of available testlets.

As with item-by-item CAT, multistage testing is almost always done using IRT as the psychometric paradigm, selection algorithm, and scoring method.  This is because IRT can score examinees on a common scale regardless of which items they see, which is not possible using classical test theory.

To learn more about MST, I recommend this book.

Why multistage testing?

Item-by-item CAT is not the best fit for all assessments, especially those that naturally tend towards testlets, such as language assessments where there is a reading passage with 3-5 associated questions.

Multistage testing allows you to realize some of the well-known benefits of adaptive testing (see below), with more control over content and exposure.  In addition to controlling content at an examinee level, it also can make it easier to manage item bank usage for the organization.


How do I implement multistage testing?

1. Develop your item banks using items calibrated with item response theory

2. Assemble a test with multiple stages, defining pools of items in each stage as testlets

3. Evaluate the test information functions for each testlet

4. Run simulation studies to validate the delivery algorithm with your predefined testlets

5. Publish for online delivery

Our industry-leading assessment platform manages much of this process for you.  The image to the right shows our test assembly screen where you can evaluate the test information functions for each testlet.

Multistage testing


Benefits of multistage testing

There are a number of benefits to this approach, which are mostly shared with CAT.

  • Shorter exams: because difficulty is targeted, you waste less time
  • Increased security: There are many possible configurations, unlike a linear exam where everyone sees the same set of items
  • Increased engagement: Lower ability students are not discouraged, and high ability students are not bored
  • Control of content: CAT has some content control algorithms, but they are sometimes not sufficient
  • Supports testlets: CAT does not support tests that have testlets, like a reading passage with 5 questions
  • Allows for review: CAT does not usually allow for review (students can go back a question to change an answer), while MST does


Examples of multistage testing

MST is often used in language assessment, which means that it is often used in educational assessment, such as benchmark K-12 exams, university admissions, or language placement/certification.  One of the most famous examples is the Scholastic Aptitude Test from The College Board; it is moving to an MST approach in 2023.

Because of the complexity of item response theory, most organizations that implement MST have a full-time psychometrician on staff.  If your organization does not, we would love to discuss how we can work together.


Psychometric software

Automated item generation (AIG) is a paradigm for developing assessment items (test questions), utilizing principles of artificial intelligence and automation. As the name suggests, it tries to automate some or all of the effort involved with item authoring, as that is one of the most time-intensive aspects of assessment development – which is no news to anyone who has authored test questions!

What is Automated Item Generation?

Automated item generation involves the use of computer algorithms to create new test questions, or variations of them.  It can also be used for item review, or the generation of answers, or the generation of assets such as reading passages.  Items still need to be reviewed and edited by humans, but this still saves a massive amount of time in test development.

Why Use Automated Item Generation?

Items can cost up to $2000 to develop, so even cutting the average cost in half could provide massive time/money savings to an organization.  ASC provides AIG functionality, with no limits, to anyone who signs up for a free item banking account in our platform  Assess.ai.

Types of Automated Item Generation?

There are two types of automated item generation.  The Item Templates approach was developed before large language models (LLMs) were widely available.  The second approach is to use LLMs, which became widely available at the end of 2022.

Type 1: Item Templates

The first type is based on the concept of item templates to create a family of items using dynamic, insertable variables. There are three stages to this work. For more detail, read this article by Gierl, Lai, and Turner (2012).

  • Authors, or a team, create an cognitive model by isolating what it is they are exactly trying to assess and different ways that it the knowledge could be presented or evidenced. This might include information such as what are the important vs. incidental variables, and what a correct answer should include .
  • They then develop templates for items based on this model, like the example you see below.
  • An algorithm then turns this template into a family of related items, often by producing all possible permutations.

Obviously, you can’t use more than one of these on a given test form. And in some cases, some of the permutations will be an unlikely scenario or possibly completely irrelevant. But the savings can still be quite real. I saw a conference presentation by Andre de Champlain from the Medical Council of Canada, stating that overall efficiency improved by 6x and the generated items were higher quality than traditionally written items because the process made the authors think more deeply about what they were assessing and how. He also recommended that template permutations not be automatically moved to the item bank but instead that each is reviewed by SMEs, for reasons such as those stated above.

You might think “Hey, that’s not really AI…” – AI is doing things that have been in the past done by humans, and the definition gets pushed further every year. Remember, AI used to be just having the Atari be able to play Pong with you!

AIG-CPR

Type 2: AI Generation or Processing of Source Text

The second type is what the phrase “automated item generation” more likely brings to mind: upload a textbook or similar source to some software, and it spits back drafts of test questions. For example, see this article by von Davier (2019). Or alternatively, simply state a topic as a prompt and the AI will generate test questions.

Until the release of ChatGPT and other publicly available AI platforms to implement large language models (LLMs), this approach was only available to experts at large organizations.  Now, it is available to everyone with an internet connection.  If you use such products directly, you can provide a prompt such as “Write me 10 exam questions on Glaucoma, in a 4-option multiple choice format” and it will do so.  You can also update the instructions to be more specific, and add instructions such as formatting the output for your preferred method, such as QTI or JSON.

Alternatively, many assessment platforms now integrate with these products directly, so you can do the same thing, but have the items appear for you in the item banker under New status, rather than have them go to a raw file on your local computer that you then have to clean and upload.  FastTest  has such functionality available.

This technology has completely revolutionized how we develop test questions.  I’ve seen several research presentations on this, and they all find that AIG produces more items, of quality that is as good or even better than humans, in a fraction of the time!  But, they have also found that prompt engineering is critical, and even one word – like including “concise” in your prompt – can affect the quality of the items.

FastTest Automated item generation

The Limitations of Automated Item Generation

Automated item generation (AIG) has revolutionized the way educational and psychological assessments are developed, offering increased efficiency and consistency. However, this technology comes with several limitations that can impact the quality and effectiveness of the items produced.

One significant limitation is the challenge of ensuring content validity. AIG relies heavily on algorithms and pre-defined templates, which may not capture the nuanced and comprehensive understanding of subject matter that human experts possess. This can result in items that are either too simplistic or fail to fully address the depth and breadth of the content domain .

Another limitation is the potential for over-reliance on statistical properties rather than pedagogical soundness. While AIG can generate items that meet certain psychometric criteria, such as difficulty and discrimination indices, these items may not always align with best practices in educational assessment or instructional design. This can lead to tests that are technically robust but lack relevance or meaningfulness to the learners .

Furthermore, the use of AIG can inadvertently introduce bias. Algorithms used in item generation are based on historical data and patterns, which may reflect existing biases in the data. Without careful oversight and adjustment, AIG can perpetuate or even exacerbate these biases, leading to unfair assessment outcomes for certain groups of test-takers .

Lastly, there is the issue of limited creativity and innovation. Automated systems generate items based on existing templates and rules, which can result in a lack of variety and originality in the items produced. This can make assessments predictable and less engaging for test-takers, potentially impacting their motivation and performance .

In conclusion, while automated item generation offers many benefits, it is crucial to address these limitations through continuous oversight, integration of expert input, and regular validation studies to ensure the development of high-quality assessment items.

How Can I Implement Automated Item Generation?

If you are a user of AI products like ChatGPT or Bard, you can work directly with them.  Advanced users can implement APIs to upload documents or fine-tune the machine learning models.  The aforementioned article by von Davier talks about such usage.

If you want to save time, FastTest provides a direct ChatGPT integration, so you can provide the prompt using the screen shown above, and items will then be automatically created in the item banking folder you specify, with the item naming convention you specify, tagged as Status=New and ready for review.  Items can then be routed through our configurable Item Review Workflow process, including functionality to gather modified-Angoff ratings.

Ready to improve your test development process?  Click here to talk to a psychometric expert.

response-time-effort

The concept of Speeded vs Power Test is one of the ways of differentiating psychometric or educational assessments. In the context of educational measurement and depending on the assessment goals and time constraints, tests are categorized as speeded and power. There is also the concept of a Timed test, which is really a Power test. Let’s look at these types more carefully.

Speeded test

In this test, examinees are limited in time but expected to answer as many questions as possible but there is a unreasonably short time limit that prevents even the best examinees from completing the test, and therefore forces the speed.  Items are delivered sequentially starting from the first one and until the last one. All items are relatively easy, usually.  Sometimes they are increasing in difficulty.  If a time limit and difficulty level are correctly set, none of the test takers will be able to reach the last item before the time limit is reached. A speeded test is supposed to demonstrate how fast an examinee can respond to questions within a time limit. In this case, examinees’ answers are not as important as their speed of answering questions. Total score is usually computed as a number of questions answered correctly when a time limit is met, and differences in scores are mainly attributed to individual differences in speed rather than knowledge.

An example of this might be a mathematical calculation speed test. Examinees are given 100 multiplication problems and told to solve as many as they can in 20 seconds. Most examinees know the answers to all the items, it is a question of how many they can finish. Another might be a 10-key task, where examinees are given a list of 100 5-digit strings and told to type as many as they can in 20 seconds.

Pros of a speeded test

  • Speeded test is appropriate for when you actually want to test the speed of examinees; the 10-digit task above would be useful in selecting data entry clerks, for example. The concept of “knowledge of 5 digit string” in this case is not relevant and doesn’t even make sense.
  • Tests can sometimes be very short but still discriminating.
  • In case when a test is a mixture of items in terms of their difficulty, examinees might save some time when responding easier items in order to respond to more difficult items. This can create an increased spread in scores.

Cons of a speeded test

  • Most situations where a test is used is to evaluate knowledge, not speed.
  • The nature of the test provokes examinees commit errors even if they know the answers, which can be stressful.
  • Speeded test does not consider individual peculiarities of examinees.


Power test

A power test provides examinees with sufficient time so that they could attempt all items and express their true level of knowledge or ability. Therefore, this testing category focuses on assessing knowledge, skills, and abilities of the examinees.  The total score is often computed as a number of questions answered correctly (or with item response theory), and individual differences in scores are attributed to differences in ability under assessment, not to differences in basic cognitive abilities such as processing speed or reaction time.

There is also the concept of a Timed Test. This has a time limit, but it is NOT a major factor in how examinees respond to questions or affect their score. For example, the time limit might be set so that 95% of examinees are not affected at all, and the remaining 5% are slightly hurried. This is done with the CAT-ASVAB.

Pros of a power test

  • There is no time restrictions for test-takers
  • Power test is great to evaluate knowledge, skills, and abilities of examinees
  • Power test reduces chances of committing errors by examinees even if they know the answers
  • Power test considers individual peculiarities of examinees

Cons of a power test

  • It can be time consuming (some of these exams are 8 hours long or even more!)
  • This test format sometimes does not suit competitive examinations because of administrative issues (too much test time across too many examinees)
  • Power test is sometimes bad for discriminative purposes, since all examinees have high chances to perform well.  There are certainly some pass/fail knowledge exams where almost everyone passes.  But the purpose of those exams is not to differentiate for selection, but to make sure students have mastered the material, so this is a good thing in that case.


Speeded test vs power test

The categorization of speed or power test depends on the assessment purpose. For instance, an arithmetical test for Grade 8 students might be a speeded test when containing many relatively easy questions but the same test could be a power test for Grade 7 students. Thus, a speeded test measures the power when all of the items are correctly responded in a limited time period. Similarly, a power test might turn into a speeded test when easy items are correctly responded in shorter time period. Once a time limit is fixed for a power test, it becomes a speeded test. Today, a pure speeded or power test is rare. Usually, what we meet in practice is a mixture of both, typically a Timed Test.

Below you may find a comparison of a speeded vs power test, in terms of the main features.


Speeded test Power test
Time limit is fixed, and it affects all examinees There is no time limit, or there is one and it only affects a small percentage of examinees
The goal is to evaluate speed only, or a combination of speed and correctness The goal is to evaluate correctness in the sense knowledge, skills, and abilities of test-takers
Questions are relatively easy in nature Questions are relatively difficult in nature
Test format increases chances of committing errors Test format reduces chances of committing errors


math educational assessment

Educational assessment of Mathematics achievement is a critical aspect of most educational ministries and programs across the world. One might say that all subjects at school are equally important and that would be relatively true. However, Mathematics stands out amongst the remaining ones, because it is more than just an academic subject. Here are three reasons why Math is so important:

Math is everywhere. Any job is tough to be completed without mathematical knowledge. Executives, musicians, accountants, fashion designers, and even mothers use Math in their daily lives. In particular, Math is essential for decision-making in the fast-growing digital world.

Math designs thinking paths. Math enables people, especially children, to analyze and solve real-world problems by developing logical and critical thinking. Einstein’s words describe this fact inimitably, “Pure mathematics is, in its way, the poetry of logical ideas”.

Math is a language of science. Math gives tools for understanding and developing engineering, science, and technology. Mathematical language, including symbols and their meanings, is the same in the world, so scientists use math to communicate concepts.

No matter which profession a student has chosen, he would likely need some solid knowledge in Math to enter an undergraduate or a graduate program. Some world-known tests that contain Math part are TIMSS, PISA, ACT, SAT, SET, and GRE.

The role of educational assessment of Math

Therefore, an important subject like Math needs careful and accurate assessment approaches starting from school. Educational assessment is the process of collecting data on student progress in knowledge acquisition to inform future academic decisions towards learning goals. This is true at the individual student level, teacher or school level, district level, and state or national level. There are different types of assessment depending on its scale, purpose, and functionality of the data collected. Effective test preparation is crucial to help students perform to the best of their abilities and gain confidence in their mathematical skills.calculator-math

In general, educational authorities in many countries apply criteria-based approach for classroom and external assessment of Mathematics. Criteria help divide a construct of knowledge into edible portions so that students understand what they have to acquire and teachers could positively interfere student individual learning paths to make sure that at the end students achieve learning goals.

Classroom assessment or assessment for learning is curriculum-based. Teachers use learning objectives from Math curriculum to form assessment criteria and make tasks according to the latter. Teachers employ assessment results for making informed decisions on the student level.

External assessment or assessment of learning is also curriculum-based but it covers much more topics than classroom assessment. Tasks are made by external specialists, usually from an independent educational institution. Assessment procedure itself is likely to be invigilated and its results are used by different authorities, not just teachers, to evaluate student progress in learning Math but also curriculum.

Applications of educational assessment of Math

Aforementioned types of assessment are classroom- and school-level, and both are mostly formatted as pen-and-pencil tests. There are some other internationally recognized assessment programs focusing on Math, such as Programme for International Student Assessment (PISA). PISA set a global trend of applying knowledge and skills in Math to solving real-world problems.

In 2018, PISA became a computerized adaptive test which is a great shift favoring all students with various levels of knowledge in Math. Application of adaptive technologies in Math for assessment and evaluation purposes could greatly motivate students because the majority of them are not big fans of Math. Thus, teachers and other stakeholders could get more valid and reliable data on student progress in learning Math.

Implementation of educational assessment of Math

The first steps towards implementation of modern technologies for educational assessment of Math at schools and colleges are extensive research and planning. Second, there has to be a pool of good items written according to the best international practices. Third, assessment procedures have to be standardized. Finally yet importantly, schools would need a consultant with rich expertise in adaptive technologies and psychometrics.

An important consideration is the item types of formats to be used.  FastTest allows you to not only use traditional formats like multiple choice, but advanced formats like drag and drop or the presentation of an equation editor to the student.  An example of that is below.


Equation editor item type


Why is educational assessment of Math so important?

Educational assessment of Math is one of the major focuses of PISA and other assessments for good reason.  Since Math skills translate to job success in many fields, especially STEM fields, a well-educated workforce is one of the necessary components of a modern economy.  So an educational system needs to know that it is preparing students for the future needs of the economy.  One aspect of this is progress monitoring, which tracks learning over time so that we can not only help individual students but also effect the aggregate changes needed to improve the educational system.


healthcare certification

An Objective Structured Clinical Examination (OSCE Exam) is an assessment designed to measure performance of tasks, typically medical, in a high-fidelity way.  It is more a test of skill than knowledge.  For example, I used to work at a certification board for ophthalmic assistants; there were 3 levels, and the top two levels included both a knowledge test (200 multiple choice items) and an OSCE (level 2 was a digital simulation, level 3 was live human patients).

OSCE exams serve a very important purpose in many fields, forging a critical bridge between learning and practice.  This post will cover some of the basics.


What is an Objective Structured Clinical Examination?

An OSCE exam typically works by defining very specific tasks that the examinee is required to do, while examiners (often professors) watch them while grading them via a rubric or checklist.  Each of the tasks is often called a station, and the OSCE will often have multiple stations.  Consider the compclinical examinationonents of the name:

  • Objective: We are trying to be as objective as possible, boiling down a potentially very complex patient scenario and task into a checklist or rubric. We want to make it quantitative, measurable, and reliable.
  • Structured: The task itself is very boxed, such as using retinoscopy to measure astigmatism (perhaps one thing of 20 that might happen at a visit to your ophthalmologist).
  • Clinical: The task is something to be done in a clinical setting; this is to increase fidelity and validity.

A great summary is provided by Zayyan (2011):

The Objective Structured Clinical Examination is a versatile multipurpose evaluative tool that can be utilized to assess health care professionals in a clinical setting. It assesses competency, based on objective testing through direct observation. It is precise, objective, and reproducible allowing uniform testing of students for a wide range of clinical skills. Unlike the traditional clinical exam, the OSCE could evaluate areas most critical to performance of health care professionals such as communication skills and ability to handle unpredictable patient behavior.

There are a few key points here.

  • It is a clinical setting, rather than a lecture hall setting (though in non-medical fields, “clinical setting” is relative!)
  • It is assessing competency of clinical skills
  • It is based on observation, where examiners rate the examinee
  • It will often include assessment of “soft skills” or other non-knowledge aspects


Where are OSCE Exams used?

OSCE exams are very important in the medical professions.  This report shows that many medical schools use it, though it curiously does not say how many schools were part of the survey.

However, it is most certainly not limited to medical fields.  You don’t hear the term very often outside medical education, but the approach is used widely.   Professions where someone is physically doing something are more likely to use OSCEs.  An accountant, on the other hand, does no physically do something, and their equivalent of an OSCE is more like a complex accounting scenario that needs to be completed in MS Excel and then graded.


Examples of OSCE exams

Of course, there are many medical examples.  I work with the American Board of Chiropractic Sports Physicians, who have a practicNurse skill testal exam.  Check out their DACBSP® webpage and scroll down to the Practical Exam resources, including instructional videos for some stations.

I once worked with a crane operator certification.  They had a performance test where you had to drive the crane into a certain position, lift and place certain objects, and then move a wrecking ball through a path of oil drums without knocking anything over – all while being rated by an examiner with a checklist.  Sounds a lot like an OSCE?

Perhaps the most common OSCE is one that you have likely taken: a Driver’s test.  In addition to taking a knowledge test, you were also likely asked to drive a car with an examiner armed with a checklist while he told you to do various “stations” like parallel parking, perpendicular parking, or navigating a stoplight.


Tell me more!

There are dedicated resources in the world of medical education and assessment, such as Downing and Yudkowsky (2019) Assessment in Health Professions Education (https://www.routledge.com/Assessment-in-Health-Professions-Education/Yudkowsky-Park-Downing/p/book/9781315166902).   You might also be interested in my Lecture Notes from a course taught using that textbook.

bias scales

One of the primary goals of psychometrics and assessment research is to ensure that tests, their scores, and interpretations of the scores, are reliable, valid, and fair. The concepts of reliability and validity are discussed quite often and are well-defined, but what do we mean when we say that a test is fair or unfair? We’ll discuss it here. Though note that fairness is technically part of validity, because if there is bias, then the interpretations being made from scores are usually biased as well.

What do we mean by bias?

Well, there are actually three types of bias in assessment.

1. Differential item functioning (DIF)/ differential test functioning (DTF)

This type of bias occurs when a single item, or sometimes a test, is biased against a group when ability/trait level is constant. For example, suppose that the reference group (usually the majority) and focal group (usually a minority) perform similarly on the test overall, but on one item we find that the focal group was less likely to get the item correct after adjusting for total score performance. This is known as differential item functioning (DIF). Content experts should review the question.

2. Overall test bias

With this type of bias, we find that the entire test is biased against the focal group, so that they receive lower scores (ability/trait estimate) than the reference group. This is especially concerning if there is data from another test or variable that shows the two groups should be of equal ability. However, there are many cases where the focal group has lower scores not because the test is biased, but because of some other reason. For example, if it is economically disadvantaged and receives subpar educational opportunities, the test could very well be valid and simply reflect these well-known inequities.

3. Predictive bias

This is a complex situation. Suppose that the test itself was not biased, but it is used to predict something like job performance or university admissions, and the test scores systematically underpredict performance for the focal group. This is manifested in the predictive model, such as a linear regression, and not in the test scores. There is also selection bias, where a focal group ends up not being selected as often.  In the USA, a rule of thumb is the four-fifths rule.

Other types of unfairness

There are other ways that a test can be considered unfair. One is the case of unequal precision. This refers to the situation that is the case with almost all traditional exams that there are plenty of items of middle difficulty, but not as many items that are easy or difficult. This can lead to very inaccurate scores for examinees on the top or bottom of the distribution. It is one reason that scaled scores are often capped on the ends of the spectrum; the difference between a person at the 98th percentile vs 99th percentile is most likely not meaningful, even if there is a wide difference in the raw scores.

Another is the case of test adaptation and translation. Here, the original test and its items might be unbiased, but when the test is translated or adapted to a different language or culture, it becomes biased. In such cases, the data might manifest itself as DIF/DTF or test bias as described above. I recall a story that a friend of mine told me about an item that was translated to Spanish, where the original item in English was quite strong and unbiased, but when used in Latin America it touched on a cultural aspect that was not present in USA/Canada, and performed poorly.

How can we find test bias?

Psychometricians have a number of statistical methods that are designed to specifically look for the situations described here. Differential item functioning in particular has a ton of scientific literature devoted to it. One example method, which is older but still commonly used, is the Mantel-Haenszel statistic. For predictive bias, I remember learning about the partial F-test in graduate school, but have not had the opportunity to perform such analyses since then.

How do we address or avoid test bias?

As with many things, an ounce of prevention is worth a pound of cure. High-stakes exams such as university admissions will invest heavily in avoiding bias. They will create detailed item writing guidelines, heavily train the item writers, and pay for items to be reviewed not only by experts but by people who are representative of target populations. Of course, some issues will always slip through this process, which is why it is important to perform the statistical analyses afterwards to validate the items, the test, and predictive models.

Where can I learn more?

Here are some relevant resources to help you learn more about test bias.

Handbook of Methods for Detecting Test Bias

Test Bias in Employment Selection Testing: A Visual Introduction

Differential Item Functioning

student-progress-monitoring

Progress monitoring is an essential component of a modern educational system and is often facilitated through Learning Management Systems (LMS), which streamline the tracking of learners’ academic achievements over time. Are you interested in tracking learners’ academic achievements during a period of learning, such as a school year? Then you need to design a valid and reliable progress monitoring system that would enable educators assist students in achieving a performance target. Progress monitoring is a standardized process of assessing a specific construct or a skill that should take place often enough to make pedagogical decisions and take appropriate actions. Implementing vertical scaling allows for the consistent measurement of student growth over time, ensuring that progress is accurately captured and meaningful comparisons are made across different grade levels.


Why Progress monitoring?

Progress monitoring mainly serves two purposes: to identify students in need and to adjust instructions based on assessment results. Such adjustments can be used on both individual and aggregate levels of learning. Educators should use progress monitoring data to make decisions about whether appropriate interventions should be employed to ensure that students obtain support to propel their learning and match their needs (Issayeva, 2017).

This assessment is usually criterion-referenced and not normed. Data collected after administration can show a discrepancy between students’ performances in relation to the expected outcomes, and can be graphed to display a change in rate of progress over time.

Progress monitoring dates back to the 1970s when Deno and his colleagues at the University of Minnesota initiated research on applying this type of assessment to observe student progress and identify the effectiveness of instructional interventions (Deno, 1985, 1986; Foegen et al., 2008). Positive research results suggested to use progress monitoring as a potential solution of the educational assessment issues existing in the late 1980s–early 1990s (Will, 1986).


Approaches to development of measures

Two approaches to item development are highly applicable these days: robust indicators and curriculum sampling (Fuchs, 2004). It is interesting to note, that advantages of using one approach tend to mirror disadvantages of the other one.

According to Foegen et al. (2008), robust indicators represent core competencies integrating a variety of concepts and skills. Classic examples of robust indicator measures are oral reading fluency in reading and estimation in Mathematics. The most popular illustration of this case is the Program for International Student Assessment (PISA) that evaluates preparedness of students worldwide to apply obtained knowledge and skills in practice regardless of the curriculum they study at schools (OECD, 2012).

When using the second approach, a curriculum is analyzed and sampled in order to construct measures based on its proportional representations. Due to the direct link to the instructional curriculum, this approach enables teachers to evaluate student learning outcomes, consider instructional changes, and determine eligibility for other educational services. Progress monitoring is especially applicable when curriculum is spiral (Bruner, 2009) since it allows students revisit the same topics with increasing complexity.


CBM and CAT

Curriculum-based measures (CBMs) are commonly used for progress monitoring purposes. They typically embrace standardized procedures for item development, administration, scoring, and reporting. CBMs are usually conducted under timed conditions as this allows obtain evidence of a student’s fluency within a targeted skill.

Computerized adaptive tests (CATs) are gaining more and more popularity these days, particularly within progress monitoring framework. CATs were primarily developed to replace traditional fixed-length paper-and-pencil tests and have been proven to become a helpful tool determining each learner’s achievement levels (Weiss & Kingsbury, 1984).

CATs utilize item response theory (IRT) and provide students with subsequent items based on difficulty level and their answers in real time. In brief, IRT is a statistical method that parameterizes items and examinees on the same scale, and facilitates stronger psychometric approaches such as CAT (Weiss, 2004). Thompson and Weiss (2011) suggest a step-by-step guidance on how to build CATs.

For more details about computerized adaptive testing, I recommend watching the webinar by the father of CAT in educational settings, Professor David J. Weiss.

Progress monitoring vs. traditional assessments

Progress monitoring significantly differs from traditional classroom assessments by many reasons. First, it provides objective, reliable, and valid data on student performance, e. g. in terms of the mastery of a curriculum. Subjective judgement is unavoidable for teachers when they prepare classroom assessments for their students. On the contrary, student progress monitoring measures and procedures are standardized which guarantees relative objectivity, as well as reliability and validity of assessment results (Deno, 1985; Foegen & Morrison, 2010). In addition, progress monitoring results are not graded, and there is no preparation prior to the test. Second, it leads to thorough feedback from teachers to students. Competent feedback helps teachers adapt their teaching methods or instructions in response to their students’ needs (Fuchs & Fuchs, 2011). Third, progress monitoring enables teachers help students in achieving long-term curriculum goals by tracking their progress in learning (Deno et al., 2001; Stecker et al., 2005). According to Hintze, Christ, and Methe (2005), progress monitoring data assist teachers in identifying specific actions towards instructional changes in order to help students in mastering all learning objectives from the curriculum. Ultimately, this results in a more effective preparation of students for the final high-stakes exams.


References

Bruner, J. S. (2009). The process of education. Harvard University Press.

Deno, S. L. (1985). Curriculum-based measurement: The emerging alternative. Exceptional children, 52, 219-232.

Deno, S. L. (1986). Formative evaluation of individual student programs: A new role of school psychologists. School Psychology Review, 15, 358-374.

Deno, S. L., Fuchs, L. S., Marston, D., & Shin, J. (2001). Using curriculum-based measurement to establish growth standards for students with learning disabilities. School Psychology Review, 30(4), 507-524.

Foegen, A., & Morrison, C. (2010). Putting algebra progress monitoring into practice: Insights from the field. Intervention in School and Clinic46(2), 95-103.

Foegen, A., Olson, J. R., & Impecoven-Lind, L. (2008). Developing progress monitoring measures for secondary mathematics: An illustration in algebra. Assessment for Effective Intervention33(4), 240-249.

Fuchs, L. S. (2004). The past, present, and future of curriculum-based measurement research. School Psychology Review, 33, 188-192.

Fuchs, L. S., & Fuchs, D. (2011). Using CBM for Progress Monitoring in Reading. National Center on Student Progress Monitoring.

Hintze, J. M., Christ, T. J., & Methe, S. A. (2005). Curriculum-based assessment. Psychology in the School, 43, 45–56. doi: 10.1002/pits.20128

Issayeva, L. B. (2017). A qualitative study of understanding and using student performance monitoring reports by NIS Mathematics teachers [Unpublished master’s thesis]. Nazarbayev University.

Samson, J. M. (2016). Human trafficking and globalization [Unpublished doctoral dissertation]. Virginia Polytechnic Institute and State University.

OECD (2012). Lessons from PISA for Japan, Strong Performers and Successful Reformers in Education. OECD Publishing.

Stecker, P. M., Fuchs, L. S., & Fuchs, D. (2005). Using curriculum-based measurement to improve student achievement: Review of research. Psychology in the Schools, 42(8), 795-819.

Thompson, N. A., & Weiss, D. A. (2011). A framework for the development of computerized adaptive tests. Practical Assessment, Research, and Evaluation16(1), 1.

Weiss, D. J., & Kingsbury, G. G. (1984). Application of computerized adaptive testing to educational problems. Journal of Educational Measurement21(4), 361-375.

Weiss, D. J. (2004). Computerized adaptive testing for effective and efficient measurement in counseling and education. Measurement and Evaluation in Counseling and Development37(2), 70-84.

Will, M. C. (1986). Educating children with learning problems: A shared responsibility. Exceptional children52(5), 411-415.


vertical scaling

Vertical scaling is the process of placing scores from educational assessments that measure the same knowledge domain but at different ability levels onto a common scale (Tong & Kolen, 2008). The most common example is putting Mathematics or Language assessments for K-12 onto a single scale across grades. For example, you might have Grade 4 math curriculum, Grade 5, Grade 6… instead of treating them all as islands, we consider the entire journey and link the grades together in a single item bank. While general information about scaling can be found at What is Test Scaling?, this article will focus specifically on vertical scaling.
Why vertical scaling?

A vertical scale is incredibly important, as enables inferences about student progress from one moment to another, e. g. from elementary to high school grades, and can be considered as a developmental continuum of student academic achievements. In other words, students move along that continuum as they develop new abilities, and their scale score alters as a result (Briggs, 2010).

This is not only important for individual students, because we can track learning and assign appropriate interventions or enrichments, but also in an aggregate sense.  Which schools are growing more than others?  Are certain teachers better? Perhaps there is a noted difference between instructional methods or curricula?  Here, we are coming up to the fundamental purpose of assessment; just like it is necessary to have a bathroom scale to track your weight in a fitness regime, if a governments implements a new Math instructional method, how does it know that students are learning more effectively?

Using a vertical scale can create a common interpretive framework for test results across grades and, therefore, provide important data that inform individual and classroom instruction. To be valid and reliable, these data have to be gathered based on properly constructed vertical scales.

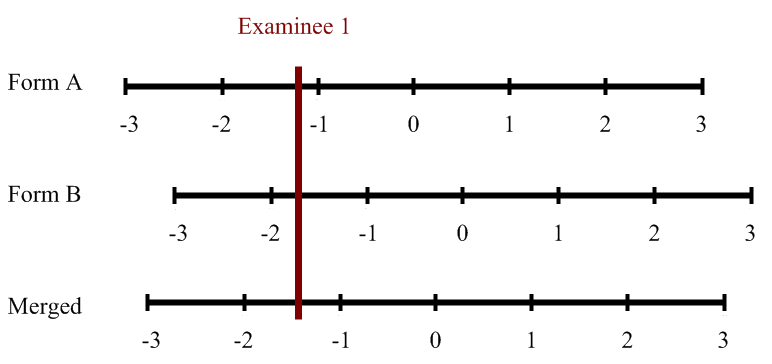
Vertical scales can be compared with rulers that measure student growth in some subject areas from one testing moment to another. Similarly to height or weight, student capabilities are assumed to grow with time.  However, if you have a ruler that is only 1 meter long and you are trying to measure growth 3-year-olds to 10-year-olds, you would need to link two rulers together.

Construction of Vertical Scales

Construction of a vertical scale is a complicated process which involves making decisions on test design, scaling design, scaling methodology, and scale setup. Interpretation of progress on a vertical scale depends on the resulting combination of such scaling decisions (Harris, 2007; Briggs & Weeks, 2009). Once a vertical scale is established, it needs to be maintained over different forms and time. According to Hoskens et al. (2003), a method chosen for maintaining vertical scales affects the resulting scale, and, therefore, is very important.

A measurement model that is used to place student abilities on a vertical scale is represented by item response theory (IRT; Lord, 2012; De Ayala, 2009) or the Rasch model (Rasch, 1960).  This approach allows direct comparisons of assessment results based on different item sets (Berger et al., 2019). Thus, each student is supposed to work with a selected bunch of items not similar to the items taken by other students, but still his results will be comparable with theirs, as well as with his own ones from other assessment moments.

The image below shows how student results from different grades can be conceptualized by a common vertical scale.  Suppose you were to calibrate data from each grade separately, but have anchor items between the three groups.  A linking analysis might suggest that Grade 4 is 0.5 logits above Grade 3, and Grade 5 is 0.7 logits above Grade 4.  You can think of the bell curves overlapped like you see below.  A theta of 0.0 on the Grade 5 scale is equivalent to 0.7 on the Grade 4 scale, and 1.3 on the Grade 3 scale.  If you have a strong linking, you can put Grade 3 and Grade 4 items/students onto the Grade 5 scale… as well as all other grades using the same approach.

Vertical-scaling

Test design

Kolen and Brennan (2014) name three types of test designs aiming at collecting student response data that need to be calibrated:

  • Equivalent group design. Student groups with presumably comparable ability distributions within a grade are randomly assigned to answer items related to their own or an adjacent grade;
  • Common item design. Using identical items to students from adjacent grades (not requiring equivalent groups) to establish a link between two grades and to align overlapping item blocks within one grade, such as putting some Grade 5 items on the Grade 6 test, some Grade 6 items on the Grade 7 test, etc.;
  • Scaling test design. This type is very similar to common item design but, in this case, common items are shared not only between adjacent grades; there is a block of items administered to all involved grades besides items related to the specific grade.

From a theoretical perspective, the most consistent design with a domain definition of growth is scaling test design. Common item design is the easiest one to implement in practice but only if administering the same items to adjacent grades is reasonable from a content perspective. Equivalent group design requires more complicated administration procedures within one school grade to ensure samples with equivalent ability distributions.

Scaling design

The scaling procedure can use observed scores or it can be IRT-based. The most commonly used scaling design procedures in vertical scale settings are the Hieronymus, Thurstone, and IRT scaling (Yen, 1986; Yen & Burket, 1997; Tong & Harris, 2004). An interim scale is chosen in all these three methodologies (von Davier et al., 2006).

  • Hieronymus scaling. This method uses a total number-correct score for dichotomously scored tests or a total number of points for polytomously scored items (Petersen et al., 1989). The scaling test is constructed in a way to represent content in an increasing order in terms of level of testing, and it is administered to a representative sample from each testing level or grade. The within- and between-level variability and growth are set on an external scaling test, which is the special set of common items.
  • Thurstone scaling. According to Thurstone (1925, 1938), this method first creates an interim-score-scale and then normalizes distributions of variables at each level or grade. It assumes that scores on an underlying scale are normally distributed within each group of interest and, therefore, makes use of a total number-correct scores for dichotomously scored tests or a total number of points of polytomously scored items to conduct scaling. Thus, Thurstone scaling normalizes and linearly equates raw scores, and it is usually conducted within equivalent groups.
  • IRT scaling. This method of scaling considers person-item interactions. Theoretically, IRT scaling is applied for all existing IRT models, including multidimensional IRT models or diagnostic models. In practice, only unidimensional models, such as the Rasch and/or partial credit models (PCM) or the 3PL models, are used (von Davier et al., 2006).

Data calibration

When all decisions are taken, including test design and scaling design, and tests are administered to students, the items need to be calibrated with software like  Xcalibre  to establish a vertical measurement scale. According to Eggen and Verhelst (2011), item calibration within the context of the Rasch model implies the process of establishing model fit and estimating difficulty parameter of an item based on response data by means of maximum likelihood estimation procedures.

Two procedures, concurrent and grade-by-grade calibration, are employed to link IRT-based item difficulty parameters to a common vertical scale across multiple grades (Briggs & Weeks, 2009; Kolen & Brennan, 2014). Under concurrent calibration, all item parameters are estimated in a single run by means of linking items shared by several adjacent grades (Wingersky & Lord, 1983).  In contrast, under grade-by-grade calibration, item parameters are estimated separately for each grade and then transformed into one common scale via linear methods. The most accurate method for determining linking constants by minimizing differences between linking items’ characteristic curves among grades is the Stocking and Lord method (Stocking & Lord, 1983). This is accomplished with software like IRTEQ.

Summary of Vertical Scaling

Vertical scaling is an extremely important topic in the world of educational assessment, especially K-12 education.  As mentioned above, this is not only because it facilitates instruction for individual students, but is the basis for information on education at the aggregate level.

There are several approaches to implement vertical scaling, but the IRT-based approach is very compelling.  A vertical IRT scale enables representation of student ability across multiple school grades and also item difficulty across a broad range of difficulty. Moreover, items and people are located on the same latent scale. Thanks to this feature, the IRT approach supports purposeful item selection and, therefore, algorithms for computerized adaptive testing (CAT). The latter use preliminary ability estimates for picking the most appropriate and informative items for each individual student (Wainer, 2000; van der Linden & Glas, 2010).  Therefore, even if the pool of items is 1,000 questions stretching from kindergarten to Grade 12, you can deliver a single test to any student in the range and it will adapt to them.  Even better, you can deliver the same test several times per year, and because students are learning, they will receive a different set of items.  As such, CAT with a vertical scale is an incredibly fitting approach for K-12 formative assessment.

Additional Reading

Reckase (2010) states that the literature on vertical scaling is scarce going back to the 1920s, and recommends some contemporary practice-oriented research studies:

Paek and Young (2005). This research study dealt with the effects of Bayesian priors on the estimation of student locations on the continuum when using a fixed item parameter linking method. First, a within group calibration was done for one grade level; then the parameters from the common items in that calibration were fixed to calibrate the next grade level. This approach forces the parameter estimates to be the same for the common items at the adjacent grade levels. The study results showed that the prior distributions could affect the results and that careful checks should be done to minimize the effects.

Reckase and Li (2007). This book chapter depicts a simulation study of the dimensionality impacts on vertical scaling. Both multidimensional and unidimensional IRT models were employed to simulate data to observe growth across three achievement constructs. The results presented that the multidimensional model recovered the gains better than the unidimensional models, but those gains were underestimated mostly due to the common item selection. This emphasizes the importance of using common items that cover all of the content assessed at adjacent grade levels.

Li (2007). The goal of this doctoral dissertation was to identify if multidimensional IRT methods could be used for vertical scaling and what factors might affect the results. This study was based on a simulation designed to match state assessment data in Mathematics. The results showed that using multidimensional approaches was feasible, but it was important that the common items would include all the dimensions assessed at the adjacent grade levels.

Ito, Sykes, and Yao (2008). This study compared concurrent and separate grade group calibration while developing a vertical scale for nine consequent grades tracking student competencies in Reading and Mathematics. The research study used the BMIRT software implementing Markov-chain Monte Carlo estimation. The results showed that concurrent and separate grade group calibrations had provided different results for Mathematics than for Reading. This, in turn, confirms that the implementation of vertical scaling is very challenging, and combinations of decisions about its construction can have noticeable effects on the results.

Briggs and Weeks (2009). This research study was based on real data using item responses from the Colorado Student Assessment Program. The study compared vertical scales based on the 3PL model with those from the Rasch model. In general, the 3PL model provided vertical scales with greater rises in performance from year to year, but also greater increases within grade variability than the scale based on the Rasch model did. All methods resulted in growth curves having less gain along with an increase in grade level, whereas the standard deviations were not much different in size at different grade levels.

References

Berger, S., Verschoor, A. J., Eggen, T. J., & Moser, U. (2019, October). Development and validation of a vertical scale for formative assessment in mathematics. In Frontiers in Education (Vol. 4, p. 103). https://doi.org/10.3389/feduc.2019.00103

Briggs, D. C., & Weeks, J. P. (2009). The impact of vertical scaling decisions on growth interpretations. Educational Measurement: Issues and Practice, 28(4), 3–14.

Briggs, D. C. (2010). Do Vertical Scales Lead to Sensible Growth Interpretations? Evidence from the Field. Online Submissionhttps://files.eric.ed.gov/fulltext/ED509922.pdf

De Ayala, R. J. (2009). The Theory and Practice of Item Response Theory. New York: Guilford Publications Incorporated.

Eggen, T. J. H. M., & Verhelst, N. D. (2011). Item calibration in incomplete testing designs. Psicológica 32, 107–132.

Harris, D. J. (2007). Practical issues in vertical scaling. In Linking and aligning scores and scales (pp. 233–251). Springer, New York, NY.

Hoskens, M., Lewis, D. M., & Patz, R. J. (2003). Maintaining vertical scales using a common item design. In annual meeting of the National Council on Measurement in Education, Chicago, IL.

Ito, K., Sykes, R. C., & Yao, L. (2008). Concurrent and separate grade-groups linking procedures for vertical scaling. Applied Measurement in Education, 21(3), 187–206.

Kolen, M. J., & Brennan, R. L. (2014). Item response theory methods. In Test Equating, Scaling, and Linking (pp. 171–245). Springer, New York, NY.

Li, T. (2007). The effect of dimensionality on vertical scaling (Doctoral dissertation, Michigan State University. Department of Counseling, Educational Psychology and Special Education).

Lord, F. M. (2012). Applications of item response theory to practical testing problems. Routledge.

Paek, I., & Young, M. J. (2005). Investigation of student growth recovery in a fixed-item linking procedure with a fixed-person prior distribution for mixed-format test data. Applied Measurement in Education, 18(2), 199–215.

Petersen, N. S., Kolen, M. J., & Hoover, H. D. (1989). Scaling, norming, and equating. In R. L. Linn (Ed.), Educational measurement (3rd ed., pp. 221–262). New York: Macmillan.

Rasch, G. (1960). Probabilistic Models for Some Intelligence and Attainment Tests. Copenhagen: Danmarks Paedagogiske Institut.

Reckase, M. D., & Li, T. (2007). Estimating gain in achievement when content specifications change: a multidimensional item response theory approach. Assessing and modeling cognitive development in school. JAM Press, Maple Grove, MN.

Reckase, M. (2010). Study of best practices for vertical scaling and standard setting with recommendations for FCAT 2.0. Unpublished manuscript. https://www.fldoe.org/core/fileparse.php/5663/urlt/0086369-studybestpracticesverticalscalingstandardsetting.pdf

Stocking, M. L., & Lord, F. M. (1983). Developing a common metric in item response theory. Applied psychological measurement, 7(2), 201–210. doi:10.1177/014662168300700208

Thurstone, L. L. (1925). A method of scaling psychological and educational tests. Journal of educational psychology, 16(7), 433–451.

Thurstone, L. L. (1938). Primary mental abilities (Psychometric monographs No. 1). Chicago: University of Chicago Press.

Tong, Y., & Harris, D. J. (2004, April). The impact of choice of linking and scales on vertical scaling. Paper presented at the annual meeting of the National Council on Measurement in Education, San Diego, CA.

Tong, Y., & Kolen, M. J. (2008). Maintenance of vertical scales. In annual meeting of the National Council on Measurement in Education, New York City.

van der Linden, W. J., & Glas, C. A. W. (eds.). (2010). Elements of Adaptive Testing. New York, NY: Springer.

von Davier, A. A., Carstensen, C. H., & von Davier, M. (2006). Linking competencies in educational settings and measuring growth. ETS Research Report Series, 2006(1), i–36. https://files.eric.ed.gov/fulltext/EJ1111406.pdf

Wainer, H. (Ed.). (2000). Computerized adaptive testing: A Primer, 2nd Edn. Mahwah, NJ: Lawrence Erlbaum Associates.

Wingersky, M. S., & Lord, F. M. (1983). An Investigation of Methods for Reducing Sampling Error in Certain IRT Procedures (ETS Research Reports Series No. RR-83-28-ONR). Princeton, NJ: Educational Testing Service.

Yen, W. M. (1986). The choice of scale for educational measurement: An IRT perspective. Journal of Educational Measurement, 23(4), 299–325.

Yen, W. M., & Burket, G. R. (1997). Comparison of item response theory and Thurstone methods of vertical scaling. Journal of Educational Measurement, 34(4), 293–313.

concurrent calibration irt equating linking

Test equating refers to the issue of defensibly translating scores from one test form to another. That is, if you have an exam where half of students see one set of items while the other half see a different set, how do you know that a score of 70 is the same one both forms? What if one is a bit easier? If you are delivering assessments in conventional linear forms – or piloting a bank for CAT/LOFT – you are likely to utilize more than one test form, and, therefore, are faced with the issue of test equating.

When two test forms have been properly equated, educators can validly interpret performance on one test form as having the same substantive meaning compared to the equated score of the other test form (Ryan & Brockmann, 2009). While the concept is simple, the methodology can be complex, and there is an entire area of psychometric research devoted to this topic. This post will provide an overview of the topic.


Why do we need test linking and equating?

The need is obvious: to adjust for differences in difficulty to ensure that all examinees receive a fair score on a stable scale. Suppose you take Form A and get a score of 72/100 while your friend takes Form B and gets a score of 74/100. Is your friend smarter than you, or did his form happen to have easier questions?  What if the passing score on the exam was 73? Well, if the test designers built-in some overlap of items between the forms, we can answer this question empirically.

Suppose the two forms overlap by 50 items, called anchor items or equator items. They are delivered to a large, representative sample. Here are the results.

Mean score on 50 overlap items Mean score on 100 total items
30 72
32 74

Because the mean score on the anchor items was higher, we then think that the Form B group was a little smarter, which led to a higher total score.

Now suppose these are the results:

Mean score on 50 overlap items Mean score on 100 total items
32 72
32 74

Now, we have evidence that the groups are of equal ability. The higher total score on Form B must then be because the unique items on that form are a bit easier.


What is test equating?

According to Ryan and Brockmann (2009), “Equating is a technical procedure or process conducted to establish comparable scores, with equivalent meaning, on different versions of test forms of the same test; it allows them to be used interchangeably.” (p. 8). Thus, successful equating is an important factor in evaluating assessment validity, and, therefore, it often becomes an important topic of discussion within testing programs.

Practice has shown that scores, and tests producing scores, must satisfy very strong requirements to achieve this demanding goal of interchangeability. Equating would not be necessary if test forms were assembled as strictly parallel, meaning that they would have identical psychometric properties. In reality, it is almost impossible to construct multiple test forms that are strictly parallel, and equating is necessary to attune a test construction process.

Dorans, Moses, and Eignor (2010) suggest the following five requirements towards equating of two test forms:

  • tests should measure the same construct (e.g. latent trait, skill, ability);
  • tests should have the same level of reliability;
  • equating transformation for mapping the scores of tests should be the inverse function;
  • test results should not depend on the test form an examinee actually takes;
  • the equating function used to link the scores of two tests should be the same regardless of the choice of (sub) population from which it is derived.

Detecting item parameter drift (IPD) is crucial for the equating process because it helps in identifying items whose parameters have changed. By addressing IPD, test developers can ensure that the equating process remains valid and reliable.


How do I calculate an equating?

Classical test theory (CTT) methods include linear equating and equipercentile equating as well as several others. Some newer approaches that work well with small samples are Circle-Arc (Livingston & Kim, 2009) and Nominal Weights (Babcock, Albano, & Raymond, 2012).  Specific methods for linear equating include Tucker, Levine, and Chained (von Davier & Kong, 2003). Linear equating approaches are conceptually simple and easy to interpret; given the examples above, the equating transformation might be estimated with a slope of 1.01 and an intercept of 1.97, which would directly confirm the hypothesis that one form was about 2 points easier than the other.

Item response theory (IRT) approaches include equating through common items (equating by applying an equating constant, equating by concurrent or simultaneous calibration, and equating with common items through test characteristic curves), and common person calibration (Ryan & Brockmann, 2009). The common-item approach is quite often used, and specific methods for finding the constants (conversion parameters) include Stocking-Lord, Haebara, Mean/Mean, and Mean/Sigma. Because IRT assumes that two scales on the same construct differ by only a simple linear transformation, all we need to do is find the slope and intercept of that transformation. Those methods do so, and often produce nice looking figures like the one below from the program IRTEQ (Han, 2007). Note that the b parameters do not fall on the identity line, because there was indeed a difference between the groups, and the results clearly find that is the case.

IRTEQ IRT equating

Practitioners can equate forms with CTT or IRT. However, one of the reasons that IRT was invented was that equating with CTT was very weak. Hambleton and Jones (1993) explain that when CTT equating methods are applied, both ability parameter (i.e., observed score) and item parameters (i.e., difficulty and discrimination) are dependent on each other, limiting its utility in practical test development. IRT solves the CTT interdependency problem by combining ability and item parameters in one model. The IRT equating methods are more accurate and stable than the CTT methods (Hambleton & Jones, 1993; Han, Kolen, & Pohlmann, 1997; De Ayala, 2013; Kolen and Brennan, 2014) and provide a solid basis for modern large-scale computer-based tests, such as computerized adaptive tests (Educational Testing Service, 2010; OECD, 2017).

Of course, one of the reasons that CTT is still around in general is that it works much better with smaller samples, and this is also the case for CTT test equating (Babcock, Albano, & Raymond, 2012).


How do I implement test equating?

Test equating is a mathematically complex process, regardless of which method you use.  Therefore, it requires special software.  Here are some programs to consider.

  1. CIPE performs both linear and equipercentile equating with classical test theory. It is available from the University of Iowa’s CASMA site, which also includes several other software programs.
  2. IRTEQ is an easy-to-use program which performs all major methods of IRT Conversion equating.  It is available from the University of Massachusetts website, as well as several other good programs.
  3. There are many R packages for equating and related psychometric topics. This article claims that there are 45 packages for IRT analysis alone!
  4. If you want to do IRT equating, you need IRT calibration software. We highly recommend Xcalibre since it is easy to use and automatically creates reports in Word for you. If you want to do the calibration approach to IRT equating (both anchor-item and concurrent-calibration), rather than the conversion approach, this is handled directly by IRT software like Xcalibre. For the conversion approach, you need separate software like IRTEQ.

Equating is typically performed by highly trained psychometricians; in many cases, an organization will contract out to a testing company or consultant with the relevant experience. Contact us if you’d like to discuss this.


Does equating happen before or after delivery?

Both. These are called pre-equating and post-equating (Ryan & Brockmann, 2009).  Post-equating means the calculation is done after delivery and you have a full data set, for example if a test is delivered twice per year on a single day, we can do it after that day.  Pre-equating is more tricky, because you are trying to calculate the equating before a test form has ever been delivered to an examinee; but this is 100% necessary in many situations, especially those with continuous delivery windows.


How do I learn more about test equating?

If you are eager to learn more about the topic of equating, the classic reference is the book by Kolen and Brennan (2004; 2014) that provides the most complete coverage of score equating and linking.  There are other resources more readily available on the internet, like this free handbook from CCSSO. If you would like to learn more about IRT, we suggest the books by De Ayala (2008) and Embretson and Reise (2000). A brief intro of IRT equating is available on our website.

Several new ideas of general use in equating, with a focus on kernel equating, were introduced in the book by von Davier, Holland, and Thayer (2004). Holland and Dorans (2006) presented a historical background for test score linking, based on work by Angoff (1971), Flanagan (1951), and Petersen, Kolen, and Hoover (1989). If you look for a straightforward description of the major issues and procedures encountered in practice, then you should turn to Livingston (2004).


Want to learn more? Talk to a Psychometric Consultant!

References

Angoff, W. H. (1971). Scales, norms and equivalent scores. In R. L. Thorndike (Ed.), Educational measurement (2nd ed., pp. 508-600). American Council on Education.

Babcock, B., Albano, A., & Raymond, M. (2012). Nominal Weights Mean Equating: A Method for Very Small Samples. Educational and Psychological Measurement, 72(4), 1-21.

Dorans, N. J., Moses, T. P., & Eignor, D. R. (2010). Principles and practices of test score equating. ETS Research Report Series2010(2), i-41.

De Ayala, R. J. (2008). A commentary on historical perspectives on invariant measurement: Guttman, Rasch, and Mokken.

De Ayala, R. J. (2013). Factor analysis with categorical indicators: Item response theory. In Applied quantitative analysis in education and the social sciences (pp. 220-254). Routledge.

Educational Testing Service (2010). Linking TOEFL iBT Scores to IELTS Scores: A Research Report. Educational Testing Service.

Embretson, S. E., & Reise, S. P. (2000). Item response theory for psychologists. Maheah.

Flanagan, J. C. (1951). Units, scores, and norms. In E. F. Lindquist (Ed.), Educational measurement (pp. 695-763). American Council on Education.

Hambleton, R. K., & Jones, R. W. (1993). Comparison of classical test theory and item response theory and their applications to test development. Educational measurement: issues and practice12(3), 38-47.

Han, T., Kolen, M., & Pohlmann, J. (1997). A comparison among IRT true-and observed-score equatings and traditional equipercentile equating. Applied Measurement in Education10(2), 105-121.

Holland, P. W., & Dorans, N. J. (2006). Linking and equating. In R. L. Brennan (Ed.), Educational measurement (4th ed., pp. 187-220). Praeger.

Kolen, M. J., & Brennan, R. L. (2004). Test equating, linking, and scaling: Methods and practices (2nd ed.). Springer-Verlag.

Kolen, M. J., & Brennan, R. L. (2014). Item response theory methods. In Test Equating, Scaling, and Linking (pp. 171-245). Springer.

Livingston, S. A. (2004). Equating test scores (without IRT). ETS.

Livingston, S. A., & Kim, S. (2009). The Circle‐Arc Method for Equating in Small Samples. Journal of Educational Measurement 46(3): 330-343.

OECD (2017). PISA 2015 Technical Report. OECD Publishing.

Petersen, N. S., Kolen, M. J., & Hoover, H. D. (1989). Scaling, norming and equating. In R. L. Linn (Ed.), Educational measurement (3rd ed., pp. 221-262). Macmillan.

Ryan, J., & Brockmann, F. (2009). A Practitioner’s Introduction to Equating with Primers on Classical Test Theory and Item Response Theory. Council of Chief State School Officers.

von Davier, A. A., Holland, P. W., & Thayer, D. T. (2004). The kernel method of test equating. Springer.

von Davier, A. A., & Kong, N. (2003). A unified approach to linear equating for non-equivalent groups design. Research report 03-31 from Educational Testing Service. https://www.ets.org/Media/Research/pdf/RR-03-31-vonDavier.pdf

bookmark-method-of-standard-setting

The Bookmark Method of standard setting (Lewis, Mitzel, & Green, 1996) is a scientifically-based approach to setting cutscores on an examination. It allows stakeholders of an assessment to make decisions and classifications about examinees that are constructive rather than arbitrary (e.g., 70%), meet the goals of the test, and contribute to overall validity. A major advantage of the bookmark method over others is that it utilizes difficulty statistics on all items, making it very data-driven; but this can also be a disadvantage in situations where such data is not available. It also has the advantage of panelist confidence (Karantonis & Sireci, 2006).

The bookmark method operates by delivering a test to a representative sample (or population) of examinees, and then calculating the difficulty statistics for each item. We line up the items in order of difficulty, and experts review the items to place a bookmark where they think a cutscore should be. Nowadays, we use computer screens, but of course in the past this was often done by printing the items in paper booklets, and the experts would literally insert a bookmark.

What is standard setting?

Standard setting (Cizek & Bunch, 2006) is an integral part of the test development process even though it has been undervalued outside of practitioners’ view in the past (Bejar, 2008). Standard setting is the methodology of defining achievement or proficiency levels and corresponding cutscores. A cutscore is a score that serves as a measure of classifying test takers into categories.

Educational assessments and credentialing examinations are often employed to distribute test takers among ordered categories according to their performance across specific content and skills (AERA, APA, & NCME, 2014; Hambleton, 2013). For instance, in tests used for certification and licensing purposes, test takers are typically classified as “pass”—those who score at or above the cutscore—and those who “fail”. In education, students are often classified in terms of proficiency; the Nation’s Report Card assessment (NAEP) in the United States classifies students as Below Basic, Basic, Proficient, Advanced.

However, assessment results could come into question unless the cutscores are appropriately defined. This is why arbitrary cutscores are considered indefensible and lacking validity. Instead, psychometricians help test sponsors to set cutscores using methodologies from the scientific literature, driven by evaluations of item and test difficulty as well as examinee performance.

When to use the bookmark method?

Two approaches are mainly used in international practice to establish assessment standards: the Angoff method (Cizek, 2006) and the Bookmark method (Buckendahl, Smith, Impara, & Plake, 2000). The Bookmark method, unlike the Angoff method, requires the test to be administered prior to defining cutscores based on test data. This provides additional weight to the validity of the process, and better informs the subject matter experts during the process. Of course, many exams require a cutscore to be set before it is published, which is impossible with the bookmark; the Angoff procedure is very useful then.

How do I implement the bookmark method?

The process of standard setting employing the Bookmark method consists of the following stages:

  1. Identify a team of subject matter experts (SMEs); their number should be around 6-12, and led by a test developer/psychometrician/statistician
  2. Analyze test takers’ responses by means of the item response theory (IRT)
  3. Create a list items according to item difficulty in an ascending order
  4. Define the competency levels for test takers; for example, have the 6-12 experts discuss what should differentiate a “pass” candidate from a “fail” candidate
  5. Experts read the items in the ascending order (they do not need to see the IRT values), and place a bookmark where appropriate based on professional judgement across well-defined levels
  6. Calculate thresholds based on the bookmarks set, across all experts
  7. If needed, discuss results and perform a second round


Example of the Bookmark Method

If there are four competency levels such as the NAEP example, then SMEs need to set up three bookmarks in-between: first bookmark is set after the last item in a row that fits the minimally competent candidate for the first level, then second and third. There are thresholds/cutscores from 1 to 2, 2 to 3, and 3 to 4. SMEs perform this individually without discussion, by reading the items.

When all SMEs have provided their opinion, the standard setting coordinator combines all results into one spreadsheet and leads the discussion when all participants express their opinion referring to the bookmarks set. This might look like the sheet below. Note that SME4 had a relatively high standard in their mind, while SME2 had a low standard in their mind – placing virtually every student above an IRT score of 0.0 into the top category!

bookmark method 1

After the discussion, the SMEs are given one more opportunity to set the bookmarks again. Usually, after the exchange of opinions, the picture alters. SMEs gain consensus, and the variation in the graphic is reduced.  An example of this is below.

bookmark method

What to do with the results?

Based on the SMEs’ voting results, the coordinator or psychometrician calculates the final thresholds on the IRT scale, and provides them to the analytical team who would ultimately prepare reports for the assessment across competency levels. This might entail score reports to examinees, feedback reports to teachers, and aggregate reports to test sponsors, government officials, and more.

You can see how the scientific approach will directly impact the interpretations of such reports. Rather than government officials just knowing how many students scored 80-90% correct vs 90-100% correct, the results are framed in terms of how many students are truly proficient in the topic. This makes decisions from test scores – both at the individual and aggregate levels – much more defensible and informative.  They become truly criterion-referenced.  This is especially true when the scores are equated across years to account for differences in examinee distributions and test difficulty, and the standard can be demonstrated to be stable.  For high-stakes examinations such as medical certification/licensure, admissions exams, and many more situations, this is absolutely critical.

Want to talk to an expert about implementing this for your exams?  Contact us.

References

[AERA, APA, & NCME] (American Educational Research Association, American Psychological Association, & National Council on Measurement in Education). (2014). Standards for educational and psychological testing. Washington, DC: American Educational Research Association.

Bejar, I. I. (2008). Standard setting: What is it? Why is it important. R&D Connections, 7, 1-6. Retrieved from https://www.ets.org/Media/Research/pdf/RD_Connections7.pdf

Buckendahl, C. W., Smith, R. W., Impara, J. C., & Plake, B. S. (2000). A comparison of Angoff and Bookmark standard setting methods. Paper presented at the Annual Meeting of the Mid-Western Educational Research Association, Chicago, IL: October 25-28, 2000.

Cizek, G., & Bunch, M. (2006). Standard Setting: A Guide to Establishing and Evaluating Performance Standards on Tests.  Thousand Oaks, CA: Sage.

Cizek, G. J. (2007). Standard setting. In Steven M. Downing and Thomas M. Haladyna (Eds.) Handbook of test development. Mahwah, NJ: Lawrence Erlbaum Associates, Publishers, pp. 225-258.

Hambleton, R. K. (2013). Setting performance standards on educational assessments and criteria for evaluating the process. In Setting performance standards, pp. 103-130. Routledge. Retrieved from https://www.nciea.org/publications/SetStandards_Hambleton99.pdf

Karantonis, A., & Sireci, S. (2006). The Bookmark Standard‐Setting Method: A Literature Review. Educational Measurement Issues and Practice 25(1):4 – 12.

Lewis, D. M., Mitzel, H. C., & Green, D. R. (1996, June). Standard setting: A Book-mark approach. In D. R. Green (Chair),IRT-based standard setting procedures utilizing behavioral anchoring. Symposium conducted at the Council of Chief State School Officers National Conference on Large-Scale Assessment, Phoenix, AZ.