In today’s digital-first world, educational institutions and organizations are leveraging technology to deliver training and instruction in more dynamic and efficient ways. A core component of this shift is the Learning Management System (LMS). But what exactly is an LMS, and why is it so critical to modern education and training? Let’s explore this transformative technology and its key features.
Understanding the Basics: What is a Learning Management System?
LMS is a software application or platform used to plan, implement, and assess a specific learning process. It provides educators, administrators, and learners with a single location for communication, course material, and assessment tools. LMS platforms are commonly used in schools, universities, corporate training programs, and online learning environments. LMS have faced a massive growth in usage due to the emphasis on remote learning during the COVID-19 pandemic.
The core function of an LMS is to make educational content accessible to users anytime, anywhere, and often at their own pace. This flexibility is crucial in accommodating the diverse needs of learners and organizations.
Key Features of a Learning Management System
Learning Management Systems are designed to simplify the process of delivering training and educational content. Here are some of the primary features that make LMS platforms so valuable:
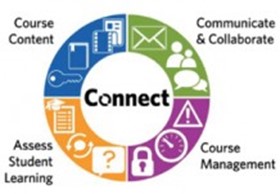
- Course Management: Create, organize, and manage courses with ease. This feature often includes the ability to upload different types of content, such as videos, presentations, PDFs, and quizzes.
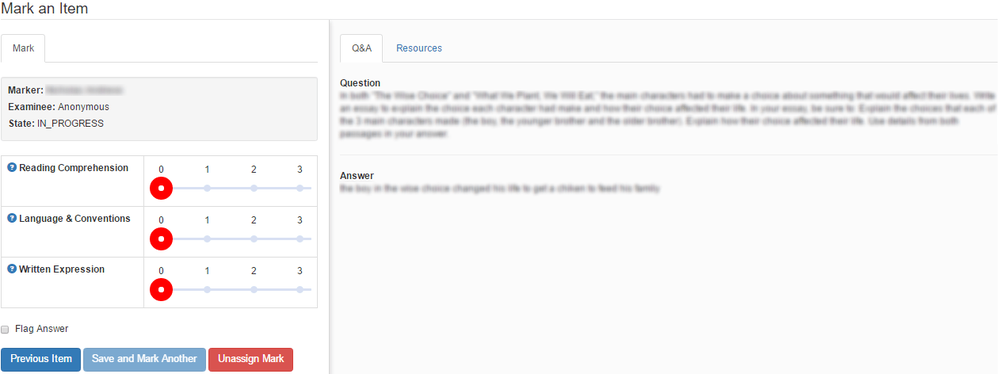
- Assessment and Tracking: LMS allows for automated assessments and grading. It can track progress, monitor engagement, and provide insights through data analytics.
- User Management: Manage user roles and permissions to control access to different parts of the platform. Instructors, administrators, and learners each have unique permissions and access.
- Communication Tools: Many LMS platforms include integrated messaging, discussion forums, and video conferencing, fostering communication between learners and educators.
- Learning Analytics: LMS often incorporates dashboards to track student progress and performance. LMS can report key items like: completion rates and success likelihood. Administrators, educators and learners can use these metrics to better understand gaps in knowledge.
Examples of Popular Learning Management System Platforms
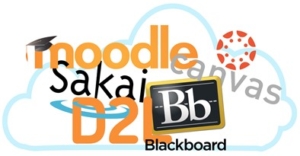
There are hundreds of LMS platforms available on the market, catering to various educational and corporate needs. The options range from open-source platforms like Moodle and Chamilo, which offer extensive customization but require technical expertise, to commercial solutions such as Blackboard and Canvas, known for their robust feature sets and support services. Pricing can vary significantly based on factors like the number of users, features, and deployment options.
Some platforms, like Google Classroom, are free for qualifying institutions. There are three paid plans. First, the Google Workspace for Education Standard plan costs $3 per student, per year and adds on a security center, advanced device and app management features, Gmail and Classroom logs for export into BigQuery, and audit logs. Then there’s the Teaching and Learning Upgrade plan that costs $4 per license, per month and includes additional features like advanced Google Meet features, unlimited originality reports and the ability to check for peer matches across a private repository. Finally, the Google Workspace for Education Plus plan costs $5 per student, per year and includes all of the features of the other plans, plus live streams with up to 100,000 in-domain viewers, syncing rosters from SISs to Google Classroom, personalized cloud search and prioritized support (Better Buys, 2023).
It’s essential to evaluate your needs and budget before choosing an LMS, as costs can quickly escalate with additional modules and support services.
Below are some widely used options:
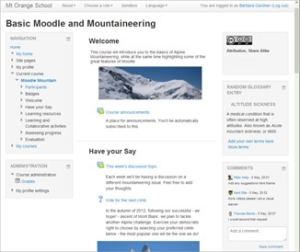
- Moodle: An open-source platform favored by educational institutions due to its flexibility and community support. Moodle is highly customizable and can be tailored to meet specific learning needs.
- Canvas: A popular choice for both K-12 and higher education, Canvas offers a clean interface and extensive integrations with third-party tools, making it ideal for tech-savvy institutions.
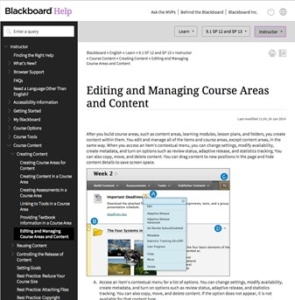
- Blackboard: Widely adopted by universities and colleges, Blackboard focuses on providing comprehensive features for large-scale educational organizations.
- Google Classroom: A simple and intuitive tool, Google Classroom is popular in K-12 settings. It integrates seamlessly with other Google products, making it a convenient option for schools already using Google Workspace.

When implementing an LMS, there are several additional expenses to consider beyond the platform’s base pricing. These include:
- Implementation and Setup Costs: Depending on the complexity of the LMS and your organization’s specific requirements, there may be initial setup costs. This could involve customizing the platform, integrating it with existing systems, and migrating existing content and user data.
- Training and Support: It’s crucial to allocate a budget for training administrators, instructors, and learners to use the LMS effectively. Some platforms offer onboarding and support as part of their package, while others charge separately for these services.
- Content Creation and Licensing: Developing new courses, multimedia content, or interactive assessments can be time-consuming and expensive. Additionally, if you’re using third-party content or e-learning modules, you may need to pay licensing fees.
- Maintenance and Upgrades: Keeping the LMS up-to-date with software patches, security updates, and new feature releases often incurs ongoing costs. Organizations that opt for self-hosted solutions will also need to consider server maintenance and IT support costs.
- Integration with Other Tools: If you plan to integrate the LMS with other systems like HR software, CRM platforms, or data analytics tools, there may be costs associated with custom integrations or purchasing additional licenses for these tools.
- Compliance and Security: Ensuring that your LMS complies with regulations (e.g., GDPR, ADA) may involve additional expenses for compliance assessments, legal consultations, and security enhancements.
- Scalability: If your organization grows, you might need to expand your LMS capacity, which could mean upgrading your plan, adding new features, or expanding server capacity—all of which can increase costs.
By considering these additional expenses, organizations can develop a more accurate budget and avoid unexpected costs during the LMS implementation process.
Why Your Organization Needs a Learning Management System
Whether you’re running a university, a corporate training program, or a small online course, an LMS can streamline your educational process. With the ability to host and organize content, track learner progress, and provide insights through analytics, an LMS offers much more than just a place to upload learning materials. It can be a strategic tool to enhance the learning experience, increase engagement, and ensure that your educational objectives are met.
Advantages of Using a Learning Management System
Learning Management Systems have become a cornerstone for modern education and corporate training environments. Here are six key benefits that define the value and effectiveness of an LMS.
- Interoperability: Seamless Integration Across Systems
One of the most significant advantages of an LMS is its ability to integrate seamlessly with other systems through standardized data formats and protocols. LMS platforms adhere to standards such as SCORM (Sharable Content Object Reference Model), xAPI (Experience API), and LTI (Learning Tools Interoperability), which enable the exchange of content and data between different applications. This level of interoperability simplifies the process of sharing resources and tracking learner progress across multiple platforms, ensuring a cohesive learning experience.
- Accessibility: Inclusive Learning for All Students
Accessibility is a critical factor in modern education, and LMS platforms are designed to support students with diverse needs, including those with disabilities. Most LMS platforms adhere to accessibility standards like the Web Content Accessibility Guidelines (WCAG), providing features such as screen reader support, keyboard navigation, and closed captioning for videos. Consistent layouts and interfaces make it easier for all users to navigate the platform and access content. By fostering an inclusive environment, an LMS can help organizations comply with legal requirements such as the Americans with Disabilities Act (ADA) and ensure that learning opportunities are available to everyone, regardless of physical or cognitive limitations.
- Reusability: Maximizing the Value of Educational Content
Reusability is a key strength of LMS platforms, enabling organizations to develop educational content once and reuse it across different courses, training programs, or departments. This feature significantly reduces the time and costs associated with creating new content for each learning module. Content created within an LMS can be structured into reusable learning objects that can be easily updated, repurposed, and shared. This flexibility is especially valuable for large organizations and educational institutions looking to standardize training materials and curricula while keeping them up-to-date with minimal effort.
- Durability: A Sustainable Solution for Long-Term Growth
As technology continues to transform education and training, the LMS market is poised for significant growth. Reports suggest that the global LMS market is expected to achieve a compound annual growth rate (CAGR) of 17.1% by 2028 (Reports, Valuates, 2022). This growth is driven by the increasing demand for flexible learning solutions, remote training, and the incorporation of new technologies like artificial intelligence and virtual reality into the learning process. By choosing a durable and scalable LMS, organizations can ensure that their investment remains relevant and adaptable to future educational trends and technologies.
- Maintainability: Ensuring a Continuously Evolving Platform
LMS platforms are designed with maintainability in mind, allowing developers to make updates, add new features, and fix bugs without disrupting the user experience. This is crucial in a rapidly changing educational landscape where learner needs and technological standards are constantly evolving. With cloud-based LMS platforms, maintenance is often handled automatically by the provider, ensuring that the system is always up-to-date with the latest security patches and performance optimizations. This continuous improvement cycle enables organizations to keep their learning environments modern, secure, and aligned with user expectations.
- Adaptability: Evolving with the Needs of Learners
Since their inception in the 1990s, LMS platforms have evolved significantly to keep up with changing societal needs and educational practices. Modern LMS platforms are highly adaptable, supporting a wide range of learning methodologies, such as blended learning, flipped classrooms, and competency-based learning. They also offer extensive customization options, allowing organizations to tailor the platform’s look and feel to match their branding and pedagogical approaches. As educational trends and technologies continue to evolve, LMS platforms are equipped to integrate emerging tools and approaches, such as gamification, microlearning, and artificial intelligence-driven personalized learning paths, making them a future-proof solution for delivering high-quality education and training.
By understanding these key advantages, organizations and institutions can leverage LMS platforms to create impactful learning experiences that not only meet current needs but are also prepared for the future of education and training.
Weaknesses of Using a Learning Management System
While Learning Management Systems offer many benefits, there are some limitations to be aware of, especially in specific contexts where advanced features are needed. Here are three key weaknesses to consider:
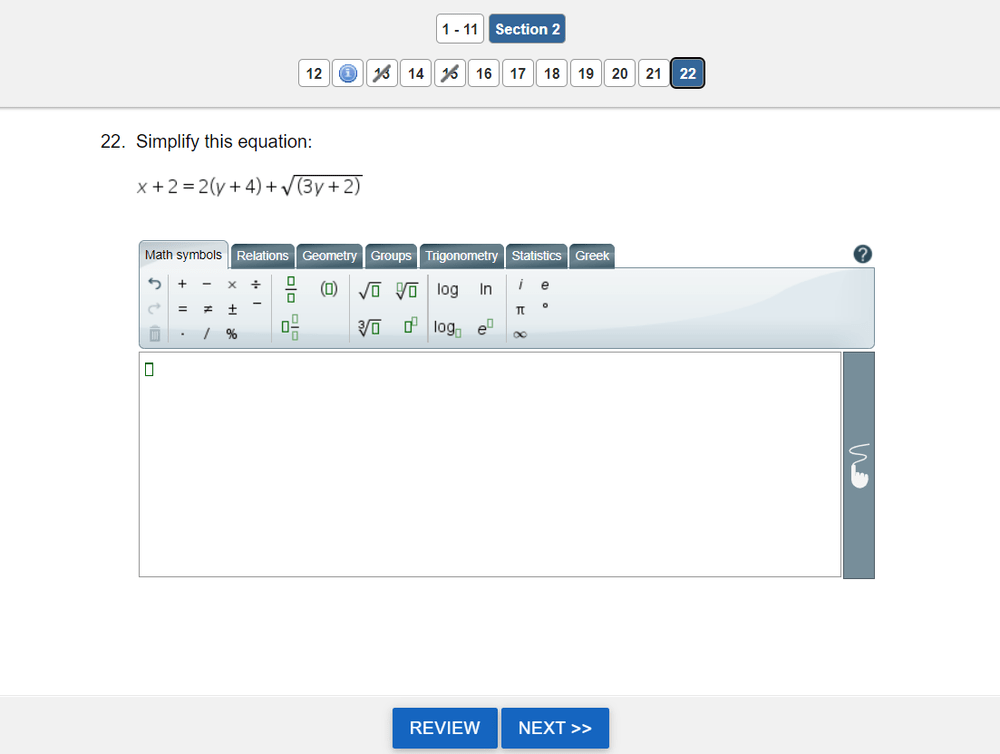
- Limited Functionality for Assessments
Many LMS platforms lack sophisticated assessment tools. While most systems support basic quizzes and exams, they may not include advanced features like item banking, Item Response Theory (IRT), or adaptive testing capabilities. This limits their use for institutions or organizations looking to implement more complex testing methodologies, such as those used in standardized assessments or psychometric evaluations. In such cases, additional software or integrations with specialized assessment platforms may be required. - Ineffective Student Management
An LMS is not designed to function as a full-fledged Student Management System (SMS). It typically lacks the robust database management features necessary for handling complex student records, attendance tracking, and detailed progress reporting. This limitation means that many organizations must integrate the LMS with a separate SMS or a Customer Relationship Management (CRM) system to gain comprehensive student management capabilities. Without these integrations, tracking student progress and managing enrollment data can become cumbersome. - Lack of e-Commerce Functionality
Not all LMS platforms include built-in e-Commerce capabilities, making it difficult to monetize courses directly within the system. For organizations looking to sell courses, certifications, or training materials, the lack of e-Commerce features can be a significant drawback. While some platforms offer plugins or third-party integrations to support payment processing and course sales, these solutions can add complexity and additional costs to the system. If selling courses or certifications is a priority, it’s crucial to choose an LMS with robust e-Commerce support or consider integrating it with an external e-Commerce platform. - Steep Learning Curve for Administrators and Instructors
LMS platforms can be complex to navigate, especially for administrators and instructors who may not have a technical background. Setting up courses, managing user roles, configuring permissions, and integrating third-party tools often require specialized training and expertise. This learning curve can lead to inefficiencies, particularly in organizations without dedicated IT or instructional design support. Training costs and time investment can add up, reducing the overall efficiency of the platform. - High Implementation and Maintenance Costs
Implementing an LMS can be expensive, especially when accounting for customization, setup, training, and content creation. Self-hosted solutions may require ongoing IT support, server maintenance, and regular updates, all of which add to the cost. Even cloud-based solutions can have hidden fees for additional features, support, or upgrades. For organizations with limited budgets, these expenses can quickly become a barrier to effective implementation and long-term use. - User Engagement and Retention Challenges
While LMS platforms offer tools for tracking engagement and participation, they can sometimes struggle to keep learners motivated, especially in self-paced or online-only environments. If the courses are not designed with engaging content or interactive features, learners may lose interest and drop out. This issue is compounded when the LMS interface is not user-friendly, leading to poor user experience and decreased retention rates. - Lack of Support for Personalized Learning Paths
While some LMS platforms offer rudimentary support for personalized learning, most struggle to deliver truly customized learning paths that adapt to individual learner needs. This limitation can hinder the ability to address diverse learning styles, knowledge levels, or specific skill gaps. As a result, organizations may need to supplement their LMS with other tools or platforms that provide adaptive learning technologies, which adds complexity to the learning ecosystem. - Data Privacy and Compliance Concerns
Depending on the region and type of data being stored, LMS platforms may not always comply with data privacy regulations such as GDPR, CCPA, or FERPA. Organizations must carefully evaluate the platform’s data security features and ensure compliance with relevant standards. Failure to meet these requirements can result in significant legal and financial repercussions.
Final Thoughts
Understanding what a Learning Management System is and how it can benefit your organization is crucial in today’s education and training landscape. With platforms like Moodle, Canvas, and Blackboard, it’s easier than ever to create engaging and effective learning experiences. Ready to explore your options? Check out some of these LMS comparisons to find the best platform for your needs.
An LMS isn’t just a tool—it’s a bridge to more effective and scalable learning solutions.
References
Reports, Valuates. (2022). “Learning Management System (LMS) Market to Grow USD 40360 Million by 2028 at a CAGR of 17.1% | Valuates Reports”. www.prnewswire.com (Press release). https://www.prnewswire.com/news-releases/learning-management-system-lms-market-to-grow-usd-40360-million-by-2028-at-a-cagr-of-17-1–valuates-reports-301588142.html
Better buys. (2023). How Much Does an LMS Cost? 2024 Pricing Guide. https://www.betterbuys.com/lms/lms-pricing-guide/


 Create Organized Notes: Gather your materials, including notes prepared in class, textbooks, and any other helpful materials.