Psychometrics
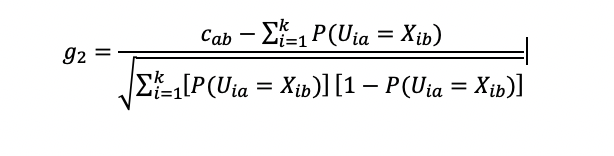
Frary, Tideman, & Watts (1977): g2 Collusion Index
The Frary, Tideman, and Watts (1977) g2 index is a collusion (cheating) detection index, which is a standardization that evaluates a number of common responses between two examinees in the typical standardized format: observed common
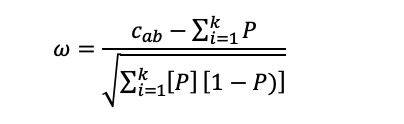
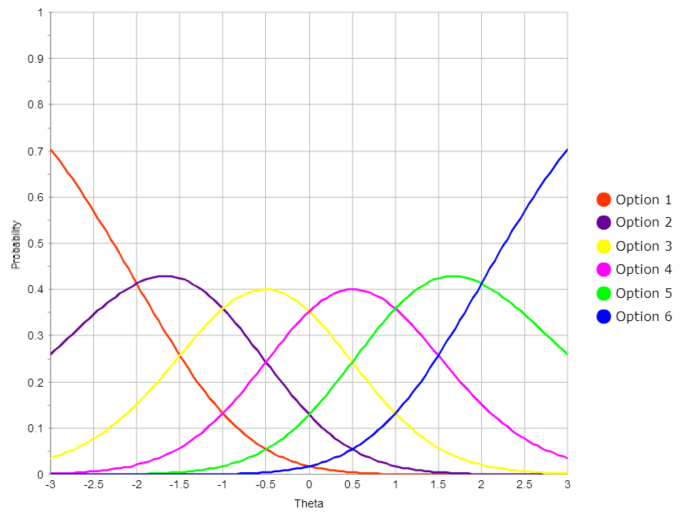
Wollack 1997 Omega Collusion Index
Wollack (1997) adapted the standardized collusion index of Frary, Tidemann, and Watts (1977) g2 to item response theory (IRT) and produced the Wollack Omega (ω) index. It is clear that the graphics in the original
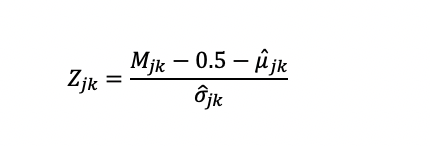
Wesolowsky (2000) Zjk Collusion Detection Index
Wesolowsky’s (2000) index is a collusion detection index, designed to look for exam cheating by finding similar response vectors amongst examinees. It is in the same family as g2 and Wollack’s ω. Like those, it

Response Time Effort
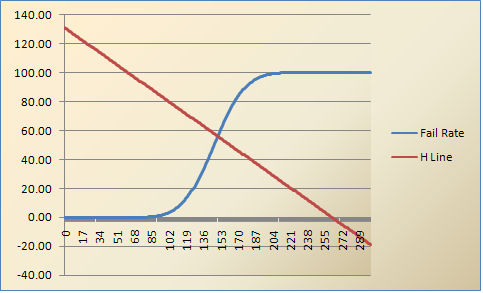
Wise and Kong (2005) defined an index to flag examinees not putting forth minimal effort, based on their response time. It is called the response time effort (RTE) index. Let K be the number of
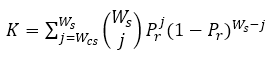
Holland K Index and K Variants for Forensics
The Holland K index and variants are probability-based indices for psychometric forensics, like the Bellezza & Bellezza indices, but make use of conditional information in their calculations. All three estimate the probability of observing wij

Guttman Errors: Additional Insight into Examinees
Guttman errors are a concept derived from the Guttman Scaling approach to evaluating assessments. There are a number of ways that they can be used. Meijer (1994) suggests an evaluation of Guttman errors as a

Identifying Threats To Test Security
Test security is an increasingly important topic. There are several causes, including globalization, technological enhancements, and the move to a gig-based economy driven by credentials. Any organization that sponsors assessments that have any stakes tied
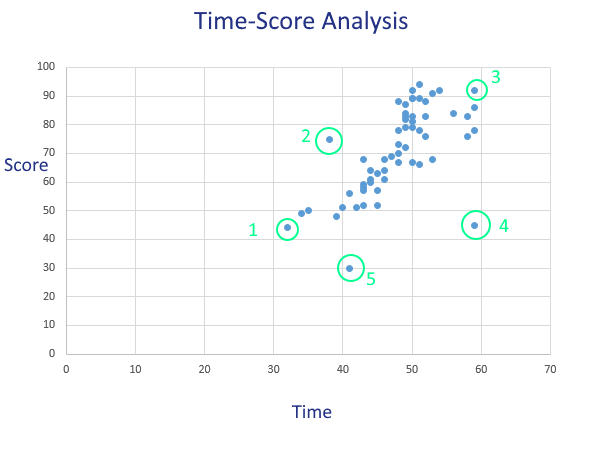
Flag Exam Cheating with Time-Score Analysis
Psychometric forensics is a surprisingly deep and complex field. Many of the indices are incredibly sophisticated, but a good high-level and simple analysis to start with is overall time vs. scores, which I call Time-Score Analysis.

What is a Psychometrician? Definition, roles, & careers.
A psychometrician is a data scientist who studies how to develop and analyze exams so that they are reliable, valid, and fair. Using psychometrics, Psychometricians implement aspects of engineering, data science, and machine learning to

Ways the Word “Standard” is used in Assessment
If you have worked in the field of assessment and psychometrics, you have undoubtedly encountered the word “standard.” While a relatively simple word, it has the potential to be confusing because it is used in
The Generalized Partial Credit Model (GPCM)
The generalized partial credit model (GPCM, Muraki 1992) is an item response theory (IRT) model designed to work with items that are partial credit. That is, instead of just right/wrong as possible, scoring an examinee

R for psychometrics
If you are dealing with data science, which psychometrics most definitely is, you’ve probably come across R. It is an environment that allows you to implement packages for many different types of analysis, which are

Subject Matter Experts (SME) in Exam Development
Subject matter experts (SME) are an important part of the process in developing a defensible exam, especially in the world of credentialing and certification. A SME is someone with deep expertise on the content of

Is teaching to the test a bad thing?
One of the most cliche phrases associated with assessment is “teaching to the test.” I’ve always hated this phrase, because it is only used in a derogatory matter, almost always by people who do not

What is the two parameter IRT model (2PL)?
Item response theory is the predominant psychometric paradigm for mid or large scale assessment. As noted in my introductory blog post, it is actually a family of models. In this post, we discuss the two

What is the three parameter IRT model (3PL)?
Item response theory (IRT) is an extremely powerful psychometric paradigm that addresses many of the inadequacies of classical test theory (CTT). If you are new to the topic, there is a broad intro here, where
What is classical item facility?
Classical test theory is a century-old paradigm for psychometrics – using quantitative and scientific processes to develop and analyze assessments to improve their quality. (Nobody likes unfair tests!) The most basic and frequently used item
What is the Hofstee method for setting cutscores?
Have you heard about standard setting approaches such as the Hofstee method, or perhaps the Angoff, Ebel, Nedelsky, or Bookmark methods? There are certainly various ways to set a defensible cutscore or a professional credentialing