
Likert Scale Items
Likert scales (items) are a type of item used in human psychoeducational assessment, primarily to assess noncognitive constructs. That is, while item types like multiple choice or short answer are used to measure knowledge or ability, Likert scales are better suited to measuring things like anxiety, conscientiousness, or motivation.
In the realm of psychology, surveys, and market analysis, Likert scales stand tall as one of the most versatile and widely used tools. Whether you’re a researcher, a marketer, or simply someone interested in understanding human attitudes and opinions, grasping the essence of Likert scales can significantly enhance your understanding of data collection and analysis. In this guide, we’ll delve into what Likert scales are, why they’re indispensable, the types of items they’re suited for, and how to score them effectively.
What is a Likert Scale/Item?
A Likert scale, named after its creator Rensis Likert, is a psychometric scale used to gauge attitudes, opinions, perceptions, and behaviors. It typically consists of a series of statements or questions that respondents are asked to rate based on a specified scale. The scale often ranges from strongly disagree to strongly agree, with varying degrees of intensity or frequency in between. Likert scales are primarily used in survey research but have found applications in various fields, including psychology, sociology, marketing, and education.
We’ve all seen these in our past; they are the items that say something like “Rate on a scale of 1 to 5.” Sometimes the numbers have descriptive text anchors, like you see below. If these are behaviorally-based, they are called Behaviorally Anchored Rating Scales (BARS).
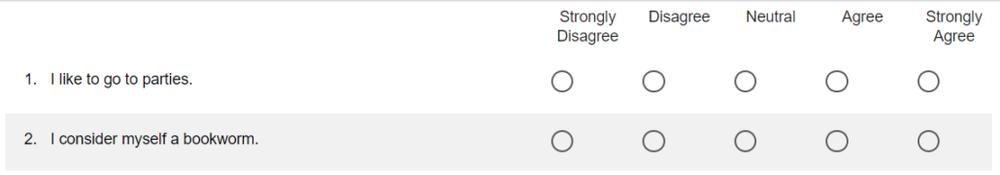
You can consider the Likert Scale to be the notion of 1 to 5 or Strongly Disagree to Strongly Agree. A Likert Item is an item on an assessment that uses a Likert Scale. In many cases, the scale is reused over items; in the example above, we have two items that use the same scale. However, the terms are often used interchangeably.
Why Use a Likert Scale?
The popularity of Likert scales stems from their simplicity, flexibility, and ability to capture nuanced responses. Here are several reasons why Likert scales are favored:
- Ease of Administration: Likert items are easy to administer, making them suitable for both online and offline surveys.
- Quantifiable Data: Likert scales generate quantitative data, allowing for statistical analysis and comparison across different groups or time points. Open response items, where an examinee might type in how they feel about something, are much harder to quantify.
- Flexibility: They can accommodate a wide range of topics and attitudes, from simple preferences to complex opinions.
- Standardization: Likert scales provide a standardized format for measuring attitudes, enhancing the reliability and validity of research findings.
- Ease of Interpretation: Likert responses are straightforward to interpret, making them accessible to both researchers. For example, in the first example above, if the average response is 4.1, we can say that respondents generally Agree with the statement.
- Ease of understanding: Since these are so commonly used, everyone is familiar with the format and can respond quickly.
What Sort of Assessments Use a Likert Scale?
Likert scales are well-suited for measuring various constructs, including:
- Attitudes: Assessing attitudes towards a particular issue, product, or service (e.g., “I believe climate change is a pressing issue”).
- Opinions: Gauging opinions on controversial topics or current events (e.g., “I support the legalization of marijuana”).
- Perceptions: Capturing perceptions of quality, satisfaction, or trust (e.g., “I am satisfied with the customer service provided”).
- Behaviors: Examining self-reported behaviors or intentions (e.g., “I exercise regularly”).
- Agreement or Frequency: Measuring agreement with statements or the frequency of certain behaviors (e.g., “I often recycle household waste”).
How Do You Score a Likert Item?
Scoring a Likert scale item involves assigning numerical values to respondents’ selected options. Typically, the scale is assigned values from 1 to 5 (or more), representing varying degrees of agreement, frequency, or intensity. In the example above, the possible scores for each item are 1, 2, 3, 4, 5. There are then two ways we can u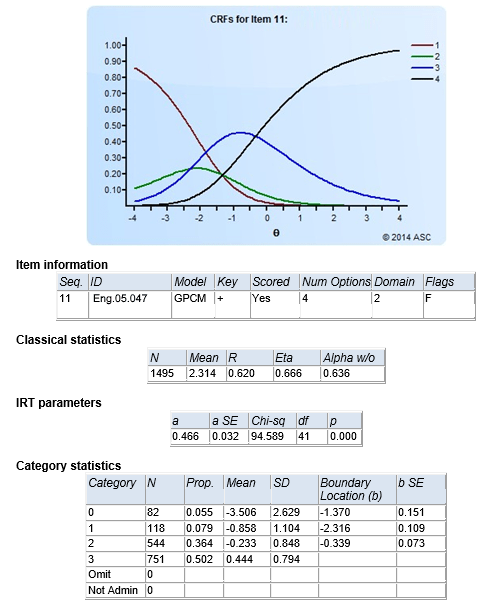 se this to obtain scores for examinees.
- Classical test theory: Either sum or average. For the former, simply add up the
- scores for all items within the scale for each respondent. If they respond as 4 to both items, their score is 8. For the latter, we find their average answer. If they answer a 3 and a 4, their score is 3.50. Note that both of these are easily interpretable.
- Item Response Theory: In large scale assessment, Likert scales are often analyzed and scored with polytomous IRT models such as the Rating Scale Model and Graded Response Model. An example of this sort of analysis is shown here.
Other important considerations:
- Reverse Coding: If necessary, reverse code items to ensure consistency (e.g., strongly disagree = 1, strongly agree = 5). In the example above, we are clearly assessing Extraversion; the first item is normal scoring, while the second item is reverse-scored. So actually, answering a 2 to the second question is really a 4 in the direction of Extraversion, and we would score it as such.
- Collapsing Categories: Sometimes, if few respondents answer a 2, you might collapse 1 and 2 into a single category. This is especially true if using IRT. The image here also shows an example of that.
- Norms: Because most traits measured by Likert scales are norm-referenced (see more on that here!), we often need to set norms. In the simple example, what does a score of 8/10 mean? The meaning is quite different if the average is 6 with a standard deviation of 1, than if the average is 8. Because of this, scores might be reported as z-scores or T-scores.
Item Analysis of Likert items
We use statistical techniques to item quality, such as average score per item or item-total correlation (discrimination). You can also perform more advanced analyses like factor analysis or regression to uncover underlying patterns or relationships. Here are some initial considerations.
- Frequency of each response: How many examinees selected each? This is the N column in the graph above. The Prop column is the same thing but converted to proportion.
- Mean score per response: This is evidence that the item is working well. Did people who answered “1” score lower overall on the Extraversion score than people who scored 3? This is definitely the case above.
- Rpbis per response, or overall R: We want the item to correlate with total score. This is strong evidence for the validity of the item. In this example, the correlation is 0.620, which is great.
- Item response theory: We can evaluate threshold values and overall item discrimination, as well as issues like item fit. This is extremely important, but beyond the scope of this post!
We also want to validate the overall test. Scores and subscores can be evaluated with descriptive statistics, and for reliability with indices like coefficient alpha.
Summary
In conclusion, Likert scales are invaluable tools for capturing and quantifying human attitudes, opinions, and behaviors. Understanding their utility and nuances can empower researchers, marketers, and decision-makers to extract meaningful insights from their data, driving informed decisions and actions. So, whether you’re embarking on a research project, designing a customer satisfaction survey, or conducting employee assessments, remember to leverage Likert scales to efficiently assess the noncognitive traits and opinions.
Nathan Thompson, PhD
Latest posts by Nathan Thompson, PhD (see all)
- What is an Assessment-Based Certificate? - October 12, 2024
- What is Psychometrics? How does it improve assessment? - October 12, 2024
- What is RIASEC Assessment? - September 29, 2024