Computerized adaptive testing is an AI-based approach to assessment where the test is personalized based on your performance as you take the test, making the test shorter, more accurate, more secure, more engaging, and fairer. If you do well, the items get more difficult, and if you do poorly, the items get easier. If an accurate score is reached, the test stops early. By tailoring question difficulty to each test-taker’s performance, CAT ensures an efficient and secure testing process.
The AI algorithms are almost always based on Item Response Theory (IRT), an application of machine learning to assessment, but can be based on other models as well.
Prefer to learn by doing? Request a free account in FastTest, our powerful adaptive testing platform.

What is computerized adaptive testing?
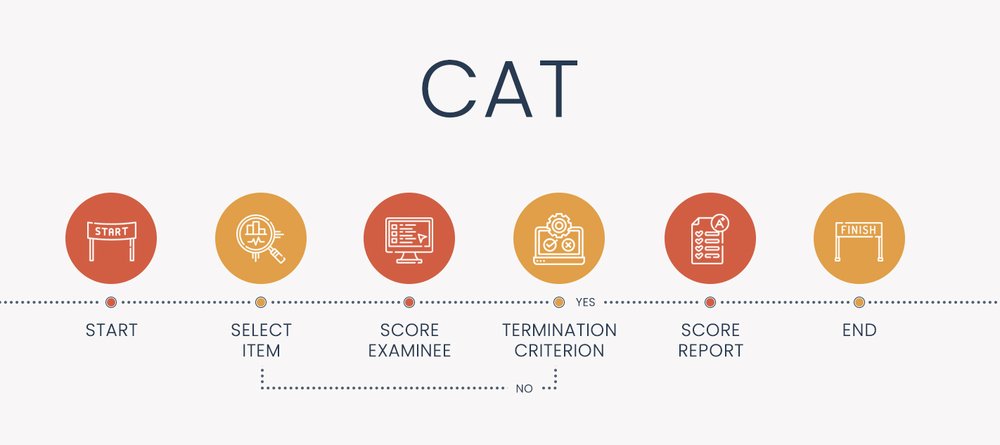
Computerized adaptive testing (CAT), sometimes called computer-adaptive testing, adaptive assessment, or adaptive testing, is an algorithm that personalizes how an assessment is delivered to each examinee. It is coded into a software platform, using the machine-learning approach of IRT to select items and score examinees. The algorithm proceeds in a loop until the test is complete. This makes the test smarter, shorter, fairer, and more precise.
The steps in the diagram above are adapted from Kingsbury and Weiss (1984). based on these components.
Components of a CAT
- Item bank calibrated with IRT
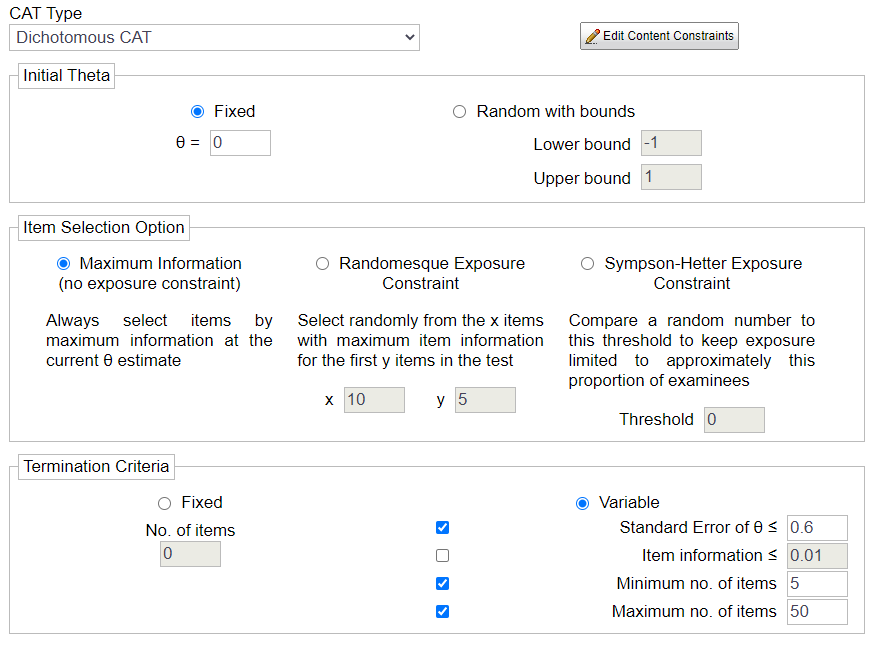
- Starting point (theta level before someone answers an item)
- Item selection algorithm (usually maximum Fisher information)
- Scoring method (e.g., maximum likelihood)
- Termination criterion (stop the test at 50 items, or when standard error is less than 0.30? Both?)
How the components work
For starters, you need an item bank that has been calibrated with a relevant psychometric or machine learning model. That is, you can’t just write a few items and subjectively rank them as Easy, Medium, or Hard difficulty. That’s an easy way to get sued. Instead, you need to write a large number of items (rule of thumb is 3x your intended test length) and then pilot them on a representative sample of examinees. The sample must be large enough to support the psychometric model you choose, and can range from 100 to 1000. You then need to perform simulation research – more on that later.
Once you have an item bank ready, here is how the computerized adaptive testing algorithm works for a student that sits down to take the test, with options for how to do so.
- Starting point: there are three option to select the starting score, which psychometricians call theta
- Everyone gets the same value, like 0.0 (average, in the case of non-Rasch models)
- Randomized within a range, to help test security and item exposure
- Predicted value, perhaps from external data, or from a previous exam
- Select item
- Find the item in the bank that has the highest information value
- Often, you need to balance this with practical constraints such as Item Exposure or Content Balancing
- Score the examinee
- Usually IRT, maximum likelihood or Bayes modal
- Evaluate termination criterion: using a predefined rule supported by your simulation research
- Is a certain level of precision reached, such as a standard error of measurement <0.30?
- Are there no good items left in the bank?
- Has a time limit been reached?
- Has a Max Items limit been reached?
The algorithm works by looping through 2-3-4 until the termination criterion is satisfied.
How does the test adapt? By Difficulty or Quantity?
CATs operate by adapting both the difficulty and quantity of items seen by each examinee.
Difficulty
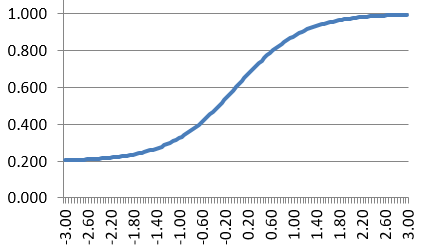
Most characterizations of computerized adaptive testing focus on how item difficulty is matched to examinee ability. High-ability examinees receive more difficult items, while low ability examinees receive easier items, which has important benefits to the student and the organization. An adaptive test typically begins by delivering an item of medium difficulty; if you get it correct, you get a tougher item, and if you get it incorrect, you get an easier item. This pattern continues.
Quantity: Fixed-Length vs. Variable-Length
A less publicized facet of adaptation is the number of items. Adaptive tests can be designed to stop when certain psychometric criteria are reached, such as a specific level of score precision. Some examinees finish very quickly with few items, so that adaptive tests are typically about half as many questions as a regular test, with at least as much accuracy. Since some examinees have longer tests, these adaptive tests are referred to as variable-length. Obviously, this makes for a massive benefit: cutting testing time in half, on average, can substantially decrease testing costs.
Some adaptive tests use a fixed length, and only adapt item difficulty. This is merely for public relations issues, namely the inconvenience of dealing with examinees who feel they were unfairly treated by the CAT, even though it is arguably more fair and valid than conventional tests. In general, it is best practice to meld the two: allow test length to be shorter or longer, but put caps on either end that prevent inadvertently too-short tests or tests that could potentially go on to 400 items. For example, the NCLEX has a minimum length exam of 75 items and the maximum length exam of 145 items.
Example of the computerized adaptive testing algorithm
Let’s walk through an oversimplified example. Here, we have an item bank with 5 questions. We will start with an item of average difficulty, and answer as would a student of below-average difficulty.
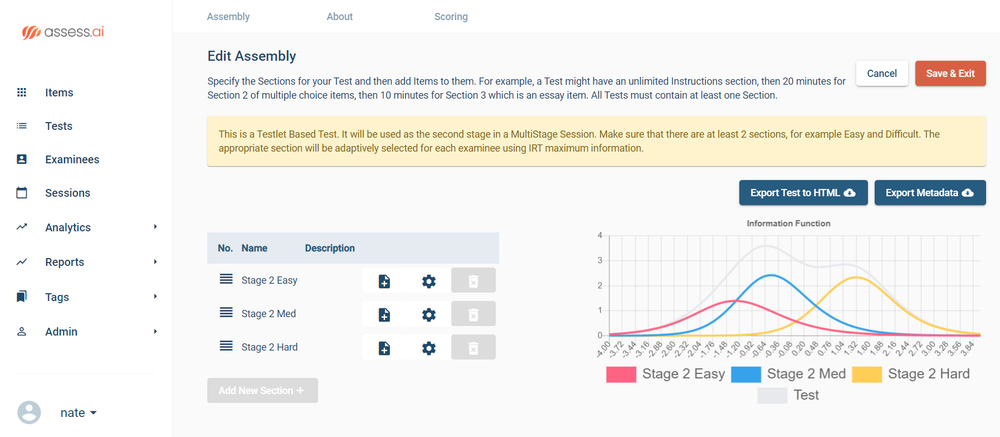
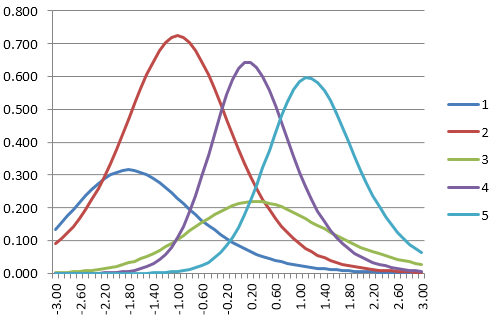
Below are the item information functions for five items in a bank. Let’s suppose the starting theta is 0.0.
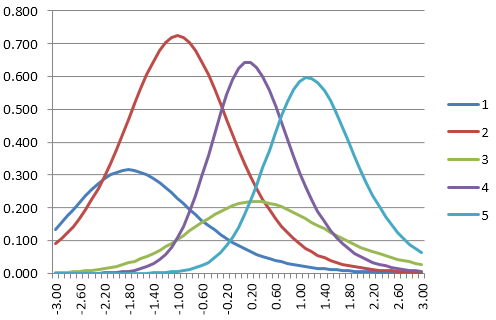
- We find the first item to deliver. Which item has the highest information at 0.0? It is Item 4.
- Suppose the student answers incorrectly.
- We run the IRT scoring algorithm, and suppose the score is -2.0.
- Check the termination criterion; we certainly aren’t done yet, after 1 item.
- Find the next item. Which has the highest information at -2.0? Item 2.
- Suppose the student answers correctly.
- We run the IRT scoring algorithm, and suppose the score is -0.8.
- Evaluate termination criterion; not done yet.
- Find the next item. Item 2 is the highest at -0.8 but we already used it. Item 4 is next best, but we already used it. So the next best is Item 1.
- Item 1 is very easy, so the student gets it correct.
- New score is -0.2.
- Best remaining item at -0.2 is Item 3.
- Suppose the student gets it incorrect.
- New score is perhaps -0.4.
- Evaluate termination criterion. Suppose that the test has a max of 3 items, an extremely simple criterion. We have met it. The test is now done and automatically submitted.
Advantages of computerized adaptive testing
Shorter tests
Research has found that adaptive tests produce anywhere from a 50% to 90% reduction in test length. This is no surprise. Suppose you have a pool of 100 items. A top student is practically guaranteed to get the easiest 70 correct; only the hardest 30 will make them think. Vice versa for a low student. Middle-ability students do no need the super-hard or the super-easy items.
Why does this matter? Primarily, it can greatly reduce costs. Suppose you are delivering 100,000 exams per year in testing centers, and you are paying $30/hour. If you can cut your exam from 2 hours to 1 hour, you just saved $3,000,000. Yes, there will be increased costs from the use of adaptive assessment, but you will likely save money in the end.
For the K12 assessment, you aren’t paying for seat time, but there is the opportunity cost of lost instruction time. If students are taking formative assessments 3 times per year to check on progress, and you can reduce each by 20 minutes, that is 1 hour; if there are 500,000 students in your State, then you just saved 500,000 hours of learning.
More precise scores
CAT will make tests more accurate, in general. It does this by designing the algorithms specifically around how to get more accurate scores without wasting examinee time.
More control of score precision (accuracy)
CAT ensures that all students will have the same accuracy, making the test much fairer. Traditional tests measure the middle students well but not the top or bottom students. Is it better than A) students see the same items but can have drastically different accuracy of scores, or B) have equivalent accuracy of scores, but see different items?
Better test security
Since all students are essentially getting an assessment that is tailored to them, there is better test security than everyone seeing the same 100 items. Item exposure is greatly reduced; note, however, that this introduces its own challenges, and adaptive assessment algorithms have considerations of their own item exposure.
A better experience for examinees, with reduced fatigue
Adaptive assessments will tend to be less frustrating for examinees on all ranges of ability. Moreover, by implementing variable-length stopping rules (e.g., once we know you are a top student, we don’t give you the 70 easy items), reduces fatigue.
Increased examinee motivation
Since examinees only see items relevant to them, this provides an appropriate challenge. Low-ability examinees will feel more comfortable and get many more items correct than with a linear test. High-ability students will get the difficult items that make them think.
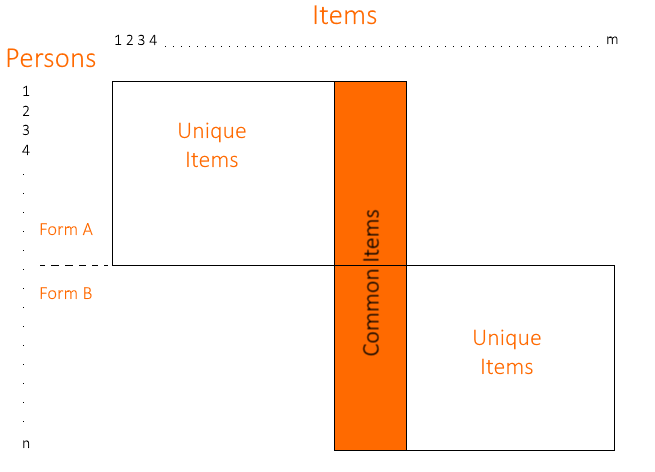
Frequent retesting is possible
The whole “unique form” idea applies to the same student taking the same exam twice. Suppose you take the test in September, at the beginning of a school year, and take the same one again in November to check your learning. You’ve likely learned quite a bit and are higher on the ability range; you’ll get more difficult items, and therefore a new test. If it was a linear test, you might see the same exact test.
This is a major reason that adaptive assessment plays a formative role in K-12 education, delivered several times per year to millions of students in the US alone.
Individual pacing of tests
Examinees can move at their own speed. Some might move quickly and be done in only 30 items. Others might waver, also seeing 30 items but taking more time. Still, others might see 60 items. The algorithms can be designed to maximize the process.
Advantages of computerized testing in general
- Immediate score reporting
- On-demand testing can reduce printing, scheduling, and other paper-based concerns
- Storing results in a database immediately makes data management easier
- Computerized testing facilitates the use of multimedia in items
- You can immediately run psychometric reports
- Timelines are reduced with an integrated item banking system
How to develop an adaptive assessment that is valid and defensible
CATs are the future of assessment. They operate by adapting both the difficulty and number of items to each individual examinee. The development of an adaptive test is no small feat, and requires five steps integrating the expertise of test content developers, software engineers, and psychometricians.
The development of a quality adaptive test is complex and requires experienced psychometricians in both item response theory (IRT) calibration and CAT simulation research. FastTest can provide you the psychometrician and software; if you provide test items and pilot data, we can help you quickly publish an adaptive version of your test.
Step 1: Feasibility, applicability, and planning studies. First, extensive monte carlo simulation research must occur, and the results formulated as business cases, to evaluate whether adaptive testing is feasible, applicable, or even possible.
Step 2: Develop item bank. An item bank must be developed to meet the specifications recommended by Step 1.
Step 3: Pretest and calibrate item bank. Items must be pilot tested on 200-1000 examinees (depends on IRT model) and analyzed by a Ph.D. psychometrician.
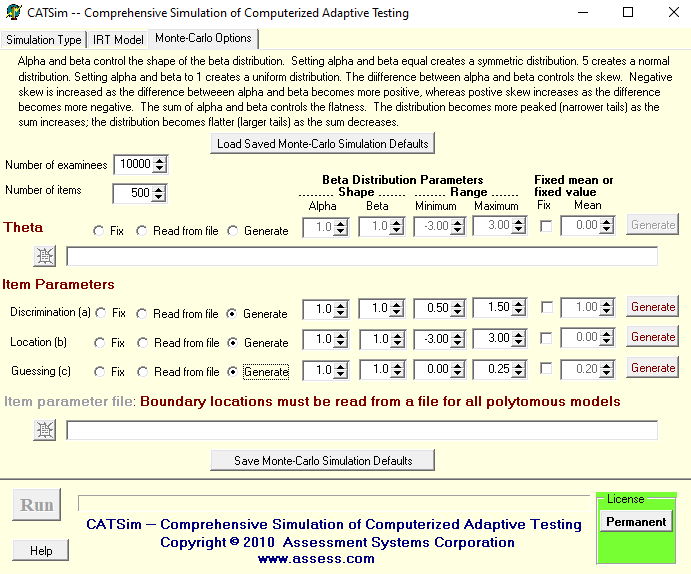
Step 4: Determine specifications for final CAT. Data from Step 3 is analyzed to evaluate CAT specifications and determine most efficient algorithms using CAT simulation software such as CATSim.
Step 5: Publish live CAT. The adaptive test is published in a testing engine capable of fully adaptive tests based on IRT. There are not very many of them out in the market. Sign up for a free account in our platform FastTest and try for yourself!
Want to learn more about our one-of-a-kind model? Click here to read the seminal article by our two co-founders. More adaptive testing research is available here.
Minimum requirements for computerized adaptive testing
Here are some minimum requirements to evaluate if you are considering a move to the CAT approach.
- A large item bank piloted so that each item has at least 100 valid responses (Rasch model) or 500 (3PL model)
- 500 examinees per year
- Specialized IRT calibration and CAT simulation software like Xcalibre and CATsim.
- Staff with a Ph.D. in psychometrics or an equivalent level of experience. Or, leverage our internationally recognized expertise in the field.
- Items (questions) that can be scored objectively correct/incorrect in real-time
- An item banking system and CAT delivery platform
- Financial resources: Because it is so complex, the development of a CAT will cost at least $10,000 (USD) — but if you are testing large volumes of examinees, it will be a significantly positive investment. If you pay $20/hour for proctoring seats and cut a test from 2 hours to 1 hour for just 1,000 examinees… that’s a $20,000 savings. If you are doing 200,000 exams? That is $4,000,000 in seat time that is saved.
Adaptive testing: Resources for further reading
Visit the links below to learn more about adaptive assessment.
- We first recommend that you first read this landmark article by our co-founders.
- Read this article on producing better measurements with CAT from Prof. David J. Weiss.
- International Association for Computerized Adaptive Testing: www.iacat.org
- Here is a video on the history of CAT, by the godfather of CAT, Prof. David J. Weiss
Examples of CAT
Many large-scale assessments utilize adaptive technology. The GRE (Graduate Record Examinations) is a prime example of an adaptive test. So is the NCLEX (nursing exam in the USA), GMAT (business school admissions), and many formative assessments like the NWEA MAP. The SAT has recently transitioned to a multistage adaptive format.
How to implement CAT
Our revolutionary platform, FastTest, makes it easy to publish a CAT. Once you upload your item texts and the IRT parameters, you can choose whatever options you please for steps 2-3-4 of the algorithm, simply by clicking on elements in our easy-to-use interface.
Contact us to sign up for a free account in our industry-leading CAT platform or to discuss with one of our PhD psychometricians.


 Offline exams have been a stepping stone towards the development of modern assessment models that are more effective. We can’t ignore the fact that there are several advantages of traditional exams.
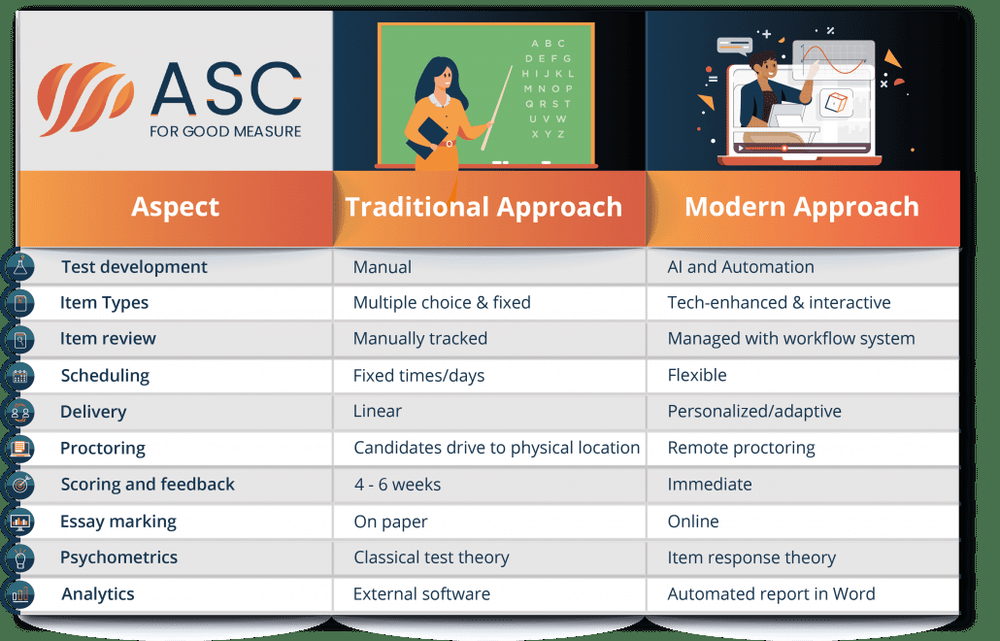


 If you want to assess how somebody performs a task, it used to be that you had to fly them in. For example, I used to work on ophthalmic exams where they would fly candidates into a clinic once a year, to do certain tasks while physicians were watching and grading. Now, many professions offer simulations of performance tests.
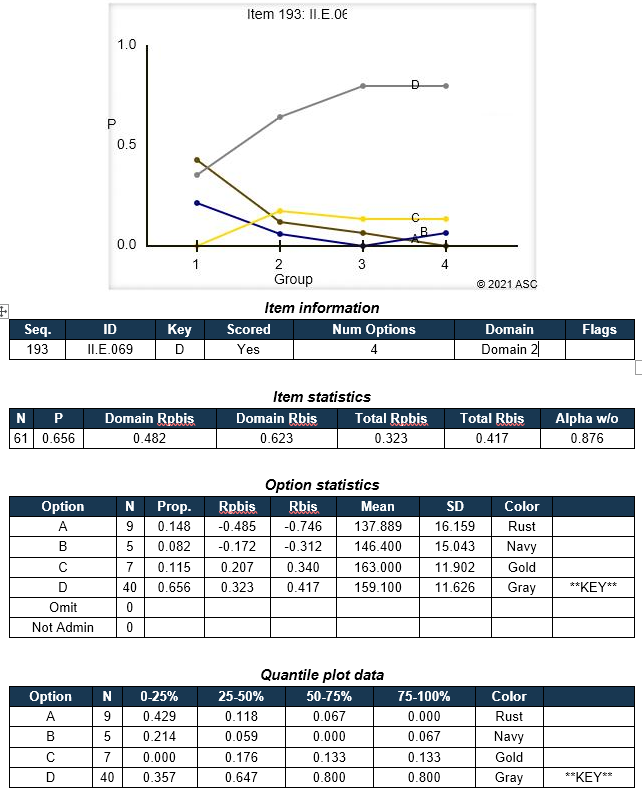 If you are using items with selected responses (including multiple choice, multiple response, and Likert), a distractor/option analysis is essential to determine if those basic building blocks are indeed up to snuff. Our reporting platform in