Certification vs Licensure exams are two terms that are used quite frequently to refer to examinations that someone has to pass to demonstrate skills in a certain profession or topic. They are quite similar, and often confused. This is exacerbated by even more similar terms in the field, such as accreditation, credentialing, certificate, and microcredentials. This post will help you understand the differences.
What is Certification?
Certification is “a credential that you earn to show that you have specific skills or knowledge. They are usually tied to an occupation, technology, or industry.” (CareerOneStop) The important aspect in this definition is the latter portion; the organization that runs the certification is generally across an industry or a profession, regardless of political boundaries. It is almost always some sort of professional association or industry board, like the American Association of Widgetmakers (obviously not a real thing). However, it is sometimes governed by a specific company or other organization regarding their products; perhaps the most well known is how Amazon Web Services will certify you in skills to hand their offerings. Many other technology and software companies do the same.
What is Licensure?
Licensure is a “formal permission to do something: esp., authorization by law to do some specified thing (license to marry, practice medicine, hunt, etc.)” (Schmitt, 1995). The key phrase here is by law. The sponsoring organization is a governmental entity, and that is defines what licensure is. In fact, licensure is not even always about a profession; almost all of us have a Driver’s License for which we passed a simple exam. Moreover, it does not always even have to be about a profession; many millions of people have a Fishing License, which is granted by the government (by States in the USA), for which you simply pay a small fee. The license is still an attestation, but not of your skills, just that you have been authorized to do something. Of course, in the context of assessment, it means that you have passed some sort of exam which is mandated by law, typically for professions that are dangerous enough or impact a wide range of people that the government has stepped in to provide oversight: attorneys, physicians, medical professionals, etc.
Certification vs Licensure Exams
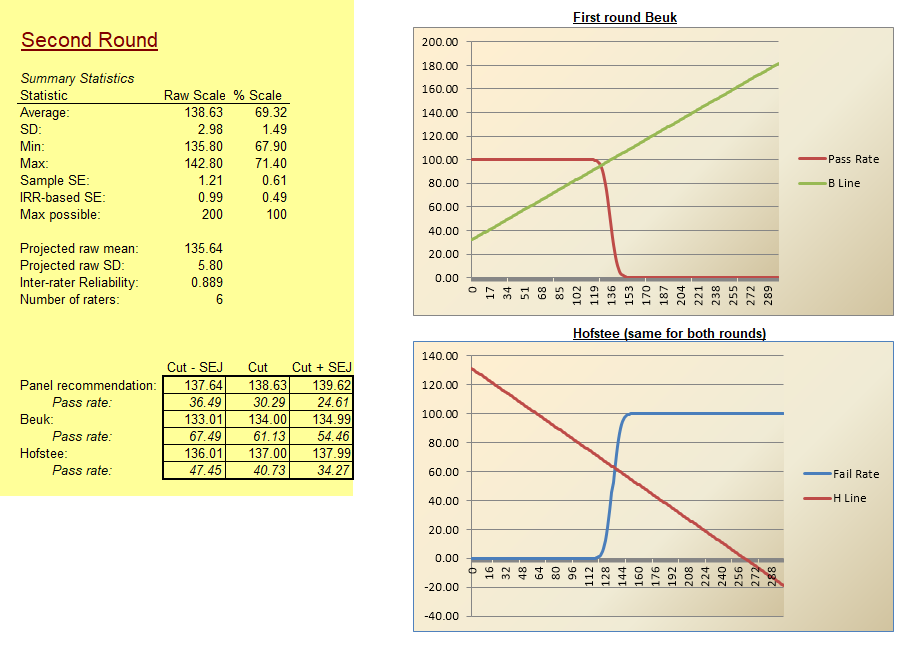
 Usually, there is a test that you must pass, but the sponsor can differ with certification vs licensure. The development and delivery of such tests is extremely similar, leading to the confusion. They often will both utilize job analysis, Angoff studies, and the like. The difference between the two is outside the test itself, and instead refers to the sponsoring organization: is it mandated/governed by a governmental entity, or is it unrelated to political/governmental boundaries? You are awarded a credential after successful completion, but the difference is in the group that awards the credential, what it means, and where it is recognized.
However, there are many licensures that do not involve an exam, but you simply need to file some paperwork with the government. An example of this is a marriage license. You certainly don’t have to take a test to qualify!
Can they be the same exam?
To make things even more confusing… yes. And it does not even have to be consistent. In the US, some professions have a wide certification, which is also required in some States as licensure, but not in all States! Some States might have their own exams, or not even require an exam. This muddles the difference between certification vs licensure.
Differences between Certification and Licensure
| Aspect | Certification | Licensure |
|---|---|---|
| Mandatory? | No | Yes |
| Run by | Association, Board, Nonprofit, Private Company | Government |
| Does it use an exam? | Yes, especially if it is accredited | Sometimes, but often not (consider a marriage license) |
| Accreditation involved? | Yes, NCCA and ANSI provide accreditation that a certification is high quality | No; often there is no check on quality |
| Examples | Certified Chiropractic Sports Physician (CCSP®), Certified in Clean Needle Technique (CNT) | Marriage license; Driver’s License; Fishing License; License to practice law (Bar Exam) |
How do these terms relate to other, similar terms?
This outline summarizes some of the relevant terms regarding certification vs licensure and other credentials. This is certainly more than can be covered in a single blog post!
- Attestation of some level of quality for a person or organization = CREDENTIALING
- Attestation of a person
- By government = LICENSURE
- By independent board or company
- High stakes, wide profession = CERTIFICATION
- Medium stakes = CERTIFICATE
- Low stakes, quite specific skill = MICROCREDENTIAL
- By an educational institution = DEGREE OR DIPLOMA
- Attestation of an organization = ACCREDITATION
- Attestation of a person


 The most obvious usage of subject matter experts in exam development is item writing and review. Again, if you are making a certification exam for experienced widgetmakers, then only experienced widgetmakers know enough to write good items. In some cases, supervisors do as well, but then they are also SMEs. For example, I once worked on exams for ophthalmic technicians; some of the SMEs were ophthalmic technicians, but some of the SMEs (and much of the nonprofit board) were ophthalmologists, the medical doctors for whom the technicians worked.