Psychometrics

The IRT Item Discrimination Parameter
The item discrimination parameter a is an index of item performance within the paradigm of item response theory (IRT). There are three item parameters estimated with IRT: the discrimination a, the difficulty b, and the

Automated Item Generation
Automated item generation (AIG) is a paradigm for developing assessment items (test questions), utilizing principles of artificial intelligence and automation. As the name suggests, it tries to automate some or all of the effort involved

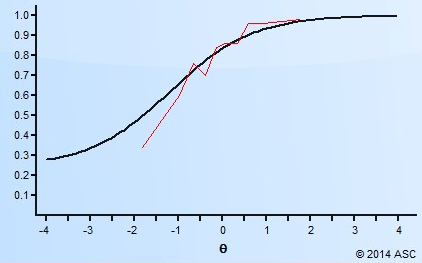
The IRT Item Difficulty Parameter
The item difficulty parameter from item response theory (IRT) is both a shape parameter of the item response function (IRF) but also an important way to evaluate the performance of an item in a test.

The One Parameter Logistic Model
The One Parameter Logistic Model (OPLM or 1PL or IRT 1PL) is one of the three main dichotomous models in the Item Response Theory (IRT) framework. The OPLM combines mathematical properties of the Rasch model

Ebel Method of Standard Setting
The Ebel method of standard setting is a psychometric approach to establish a cutscore for tests consisting of multiple-choice questions. It is usually used for high-stakes examinations in the fields of higher education, medical and health

Item Parameter Drift
Item parameter drift (IPD) refers to the phenomenon in which the parameter values of a given test item change over multiple testing occasions within the item response theory (IRT) framework. This phenomenon is often relevant
Item Fit Analysis
Item fit analysis is a type of model-data fit evaluation that is specific to the performance of test items. It is a very useful tool in interpreting and understanding test results, and in evaluating item

Distractor Analysis for Test Items
Distractor analysis refers to the process of evaluating the performance of incorrect answers vs the correct answer for multiple choice items on a test. It is a key step in the psychometric analysis process to

Confidence Interval for Test Scores
A confidence interval for test scores is a common way to interpret the results of a test by phrasing it as a range rather than a single number. We all understand that tests provide imperfect
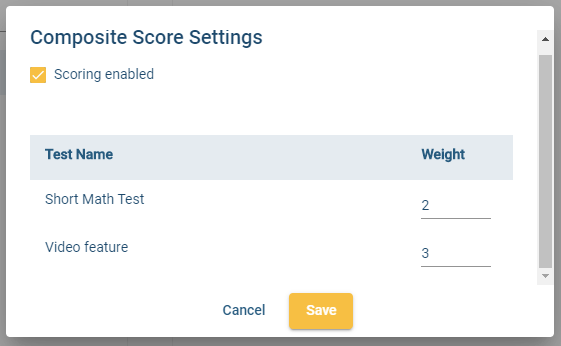
Composite Test Score
A composite test score refers to a test score that is combined from the scores of multiple tests, that is, a test battery. The purpose is to create a single number that succinctly summarizes examinee

Inter-Rater Reliability vs Agreement
Inter-rater reliability and inter-rater agreement are important concepts in certain psychometric situations. For many assessments, there is never any encounter with raters, but there certainly are plenty of assessments that do. This article will define

Split Half Reliability Index
Split Half Reliability is an internal consistency approach to quantifying the reliability of a test, in the paradigm of classical test theory. Reliability refers to the repeatability or consistency of the test scores; we definitely

Nedelsky Method of Standard Setting
The Nedelsky method is an approach to setting the cutscore of an exam. Originally suggested by Nedelsky (1954), it is an early attempt to implement a quantitative, rigorous procedure to the process of standard setting.
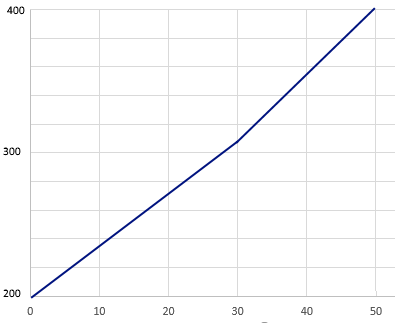
What is Scaled Scoring on a Test?
There are 4 types of scaled scoring. The rest of this post will get into some psychometric details on these, for advanced readers. Normal/standardized This is an approach to scaled scoring that many of us

What are Enemy Items?
Enemy items is a psychometric term that refers to two test questions (items) which should not be on the same test form (if linear) seen by a given examinee (if LOFT or adaptive). This can

HR Assessment for Pre-Employment: Approaches and Solutions
HR assessment is a critical part of the HR ecosystem, used to select the best candidates with pre-employment testing, assess training, certify skills, and more. But there is a huge range in quality, as well

Incremental Validity
Incremental validity is a specific aspect of criterion-related validity that refers to what an additional assessment or predictive variable can add to the information provided by existing assessments or variables. It refers to the amount

AI Remote Proctoring: How To Choose A Solution
AI remote proctoring has seen an incredible increase of usage during the COVID pandemic. ASC works with a very wide range of clients, with a wide range of remote proctoring needs, and therefore we partner