Posts on psychometrics: The Science of Assessment

student cheating on test

Test security is an increasingly important topic. There are several causes, including globalization, technological enhancements, and the move to a gig-based economy driven by credentials. Any organization that sponsors assessments that have any stakes tied to them must be concerned with security, as the greater the stakes, the greater the incentive to cheat. And threats to test security are also threats to validity, and therefore the entire existence of the assessment.

The core of this protection is a test security plan, which will be discussed elsewhere. The first phase is an evaluation of your current situation. I will present a suggested model for that here. There are five steps in this model.

1. Identify threats to test security that are relevant to your program.

2. Evaluate the possible frequency and impact of each threat.

3. Determine relevant deterrents or preventative measures for each threat.

4. Identify data forensics that might detect issues.

5. Have a plan for how to deal with issues, like a candidate found cheating.


OK, Explain These Five Steps More Deeply

1. Identify threats to test security that are relevant to your program.

threats-to-test-security

Some of the most commonly encountered threats are listed below. Determine which ones might be relevant to your program, and brainstorm additional threats if necessary. If your organization has multiple programs, this list can differ between them.

-Brain dump makers (content theft)

-Brain dump takers (pre-knowledge)

-Examinee copying/collusion

-Outside help at an individual level (e.g., parent or friend via wireless audio)

-Outside help at a group level (e.g., teacher providing answers to class)

2. Evaluate the possible frequency and impact of each threat.

Create a table with three columns. The first is the list of threats and the latter two are Frequency, and Impact, where you can rate them, such as on a scale of 1 to 5. See examples below. Again, if your organization has multiple assessments, this can vary substantially amongst them. Brain dumps might be a big problem for one program but not another. I recommend multiplying or summing the values into a common index, which you might call criticality.

3. Determine relevant proactive measures for each threat.

Start with the most critical threats. Brainstorm policies or actions that could either deter that threat, mitigate its effects, or prevent it outright. Consider a cost/benefit analysis for implementing each. Determine which you would like to put in place, in a prioritized manner.

4. Identify data forensics that might detect issues.

The adage of “An ounce of prevention is worth a pound of cure” is cliché in the field of test security, so it is certainly worth minding. But there will definitely be test security threats which will impact you no matter how many proactive measures you put into place. In such cases, you also need to consider which data forensic methods you might use to look for evidence of those threats occurring. There are wide range of such analyses – here is a blog post that talks about some.

5. Have a plan for how to deal with issues, like a candidate found cheating.

This is an essential component of the test security plan. What will you do if you find strong evidence of students coping off each other, or candidates using a brain dump site?

Note how this methodology is similar to job analysis, which rates job tasks or KSAs on their frequency and criticality/importance, and typically multiplies those values and then ranks or sorts the tasks based on the total value. This is a respected methodology for studying the nature of work, so much so that it is required to be the basis of developing a professional certification exam, in order to achieve accreditation. More information is available here.


What can I do about these threats to test security?

There are four things you can do to address threats to test security, as was implicitly described above:

1. Prevent – In some situations, you might be able to put measures in place that fully prevent the issue from occurring. Losing paper exam booklets? Move online. Parents yelling answers in the window? Hold the test in a location with no parents allowed.

2. Deter – In most cases, you will not be able to prevent the threat outright, but you can deter it. Deterrents can be up front or after the fact. An upfront deterrent would be a proctor present during the exam. An after-the-fact deterrent would be the threat of a ban from practicing in a profession if you are caught cheating.

3. Detect – You can’t control all aspects of delivery. Fortunately, there are a wide range of data forensic approaches you can use to detect anomalies. This is not necessarily limited to test security though; low item response times could be indicative of pre-knowledge or simply of a student that doesn’t care.

4. Mitigate – Put procedures into place that reduce the effect of the threat.  Examinees stealing your items?  You can frequently rotate test forms.  Examinees might still steal but at least items are only out for 3 months instead of 5 years, for example.

The first two pieces are essential components of standardized testing. The standardized in that phrase does not refer to educational standards, but rather to the fact that we are making the interaction of person with test as uniform as possible, as we want to remove as many outside variables as possible that could potentially affect test scores.


Examples

This first example is for an international certification.  Such exams are very high stakes and therefore require many levels of security.

Test Risk (1-5) Notes Result
Content theft 5 Huge risk of theft; expensive to republish Need all the help we can get.  Thieves can make real money by stealing our content.  We will have in-person proctoring in high-security centers, and also use a lockdown browser.  All data will be analyzed with SIFT.
Pre-knowledge 5 Lots of brain dump sites We definitely need safeguards to deter use of brain dump sites.  We search the web to find sites and issue DMCA takedown notices.  We analyze all candidate data to compare to brain dumps.  Use Trojan Horse items.
Proxy testers 3 Our test is too esoteric We need basic procedures in place to ensure identity, but will not spend big bucks on things like biometrics.
Proctor influence 3 Proctors couldn’t help much but they could steal content Ensure that all proctors are vetted by a third party such as our delivery vendor.

Now, let’s assume that the same organization also delivers a practice exam for this certification, which obviously has much lower security.

Test Risk (1-5) Notes Result
Content theft 2 You don’t want someone to steal the items and sell them, but it is not as big a deal as the Cert; cheap to republish Need some deterrence but in-person proctoring is not worth the investment.  Let’s use a lockdown browser.
Pre-knowledge 1 No reason to do this; actually hurts candidate No measures
Proxy testers 1 Why would you pay someone else to take your practice test? Actually hurts candidate. No measures
Proctor influence 1 N/A  No measures


It’s an arms race!

Because test security is an ongoing arms race, you will need to periodically re-evaluate using this methodology, just like certifications are required to re-perform a job analysis study every few years because professions can change over time.  New threats may present themselves while older ones fall by the wayside.

Of course, the approach discussed here is not a panacea, but it is certainly better than haphazardly putting measures in place.  One of my favorite quotes is “If you aim at nothing, that’s exactly what you will hit.”  If you have some goal and plan in mind, you have a much greater chance of success in minimizing threats to test security than if your organization simply puts the same measures in place for all programs without comparison or evaluation.

Interested in test security as a more general topic?  Attend the Conference on Test Security.

Time-Score example (annotated)

Psychometric forensics is a surprisingly deep and complex field.  Many of the indices are incredibly sophisticated, but a good high-level and simple analysis to start with is overall time vs. scores, which I call Time-Score Analysis.  This approach uses simple flagging on two easily interpretable metrics (total test time in minutes and number correct raw score) to identify possible pre-knowledge, clickers, and harvester/sleepers.  Consider the four quadrants that a bivariate scatterplot of these variables would produce.


Quadrant Interpretation Possible threat? Suggested flagging
Upper right High scores and taking their diligent time Good examinees NA
Upper left High scores with low time Pre-knowledge Top 50% score and bottom 5% time
Lower left Low scores with low time “Clickers” or other low motivation Bottom 5% time and score
Lower right Low scores with high time Harvesters, sleepers, or just very low ability Top 5% time and bottom 5% scores

An example of time-score analysis

Consider the example data below.  What can this tell us about the performance of the test in general, and about specific examinees?

This test had 100 items, scored classically (number-correct), and a time limit of 60 minutes.  Most examinees took 45-55 minutes, so the time limit was appropriate.  A few examinees spent 58-59 minutes; there will usually be some diligent students like that.  There was a fairly strong relationship of time with the score, in that examinees who took longer, scored highly.

Now, what about the individuals?  I’ve highlighted 5 examples.

  1. This examinee had the shortest time, and one of the lowest scores.  They apparently did not care very much.  They are an example of a low motivation examinee that moved through quickly.  One of my clients calls these “clickers.”
  2. This examinee also took a short time but had a suspiciously high score.  They definitely are an outlier on the scatterplot, and should perhaps be investigated.
  3. This examinee is simply super-diligent.  They went right up to the 60-minute limit and achieved one of the highest scores.
  4. This examinee also went right up to the 60-minute limit but had one of the lowest scores.  They are likely low ability or low motivation.  That same client of mine calls these “sleepers” – a candidate that is forced to take the exam but doesn’t care, so just sits there and dozes. Alternatively, it might be a harvester; some who have been assigned to memorize test content, so they spend all the time they can, but only look at half the items so they can focus on memorization.
  5. This examinee had by far the lowest score, and one of the lowest times.  Perhaps they didn’t even answer every question.  Again, there is a motivation/effort issue here, most likely.

Time-Score example (annotated)

How useful is time-score analysis?

Like other aspects of psychometric forensics, this is primarily useful for flagging purposes.  We do not know yet if #4 is a Harvester or just low motivation.  Instead of accusing them, we open an investigation.  How many items did they attempt?  Are they repeat test-takers?  What location did they take the test?  Do we have proctor notes, site video, remote proctoring video, or other evidence that we can review? 

There is a lot that can go into such an investigation.  Moreover, simple analyses such as this are merely the tip of the iceberg when it comes to psychometric forensics.  In fact, so much that I’ve heard some organizations simply stick their head in the sand and don’t even bother checking out someone like #4.  It just isn’t in the budget.

Some of this analysis is best done with specialized software for psychometric forensics, like SIFT.

However, test security is an essential aspect of validity.  If someone has stolen your test items, the test is compromised, and you are guaranteed that scores do not mean the same thing they meant when the test was published.  It’s now apples and oranges, even though the items on the test are the same.  Perhaps you might not challenge individual examinees but perhaps institute a plan to publish new test forms every 6 months. Regardless, your organization needs to have some difficult internal discussions and establish a test security plan.


A psychometrician is a data scientist who studies how to develop and analyze exams so that they are reliable, valid, and fair. Using psychometrics, Psychometricians implement aspects of engineering, data science, and machine learning to ensure that tests provide accurate information about people, so we can be confident about decisions based on test scores.  They also often manage the test development process, including the design of blueprints and management of item writers.

Psychometricians are critical for many organizations. Because best practices are relevant for any type of assessment, psychometricians work on many exams: certification, licensure, pre-employment, university admissions, K-12, etc.

What is a psychometrician?

Psychometrician Qualities

A psychometrician is like a lead engineer, applying best practices to produce a complex product that is reliable and serves the purpose of the test, such as predicting job performance.  This involves planning, management of a team of specialists, ensuring quality control, and other leadership.  However, psychometricians are often the type that like to get their hands dirty by writing code and analyzing data themselves. Psychometricians make sure that the tests are developed according to best practices like the APA/AERA/NCME Standards or NCCA Standards.  More detail on tasks is provided below.

In some parts of the world, the term psychometrician refers to someone who administers tests, typically in a counseling setting, and does not actually know anything about the development or validation of tests.  That usage is incorrect; such a person is a psychometrist, as you can see at the website for their association here.  Even major sites like ZipRecruiter don’t do the basic fact-checking to get this straight.

Why do testing organizations need a psychometrician?

A psychometrician is essential to making good tests.  The higher the stakes of the exam, the more that this is important.  If you are working with a 5th grade math quiz for 30 students, then a PhD psychometrician is overkill.  However, if you are working with a nationwide exam that certifies healthcare professionals, then it is incredibly important that the test is high quality, because patient lives are potentially on the line.  A lot of work goes into developing such exams.

If you work for a credentialing organization, you likely need a psychometrician.  Larger organizations typically hire their own as an in-house employee.  Smaller organizations typically do not have the budget.  Moreover, they likely do not have enough work to justify a full-time employee; perhaps they only release a new version of the test once per year which perhaps only takes a few months.

If this is the case, Assessment Systems can certainly help you – get in touch to talk with one of our psychometricians.

What does a Psychometrician do?

There are many steps that go into developing a high quality, defensible assessment. These differ by the purpose of the test.  When working on professional certifications or employment tests, a job analysis is typically necessary and is frequently done by a psychometrician. Yet job analysis totally irrelevant for K-12 formative assessments; the test is based on a curriculum, so a psychometrician’s time is spent elsewhere.

Some topics include:

This is a highly quantitative profession.  Psychometricians spend most of their time working with datasets, using specially designed software or writing code in languages like R and Python.

A simple example of item analysis is shown below.  This is an English vocabulary question.  This question is extremely difficult; only 37% of students get it correct even though there is a 25% chance just by guessing.  The item would probably be flagged for review.  However, the point-biserial discrimination is extremely high, telling us that the item is actually very strong and defensible.  Lots of students choose “confetti” but it is overwhelmingly the lower students, which is exactly what we want to have happen!  The smarter students selected “candy.”

Confectioner-confetti

What skills do I need to become a Psychometrician?

There are two types of psychometrician: client-facing and data-facing.  Though many psychometricians have skills in both domains.

Client-facing psychometricians excel in what one of my former employers called Client Engagements; parts of the process where you work directly with subject matter experts and stakeholders.  Examples of this are job analysis studies, test design workshops, item writing workshops, and standard setting.  All of these involve the use of an expert panel to discuss certain aspects.  The skills you need here are soft skills; how to keep the SMEs engaged, meeting facilitation and management, explaining psychometric concepts to a lay person, and – yes – small talk during breaks!

Data-facing psychometricians focus on the numbers.  Examples of this include equating, item response theory analysis, classical test theory reports, and adaptive testing algorithms.  My previous employer called this the Client Reporting Team.  The skills you need here are quite different, and center around data analysis and writing code.

How do I get a job as a Psychometrician?

First, you need a graduate degree.  In this field, a Master’s degree is considered entry-level, and a PhD is considered a standard level of education.  It can often be in a related area like I/O psychology.  Given that level of education, and the requirement for advanced data science skills, this career is extremely well-paid.

Wondering what kind of opportunities are out there?  Check out the NCME Job Board and Horizon Search, a headhunter for assessment professionals.

Where does a Psychometrician work?

They work any place that develops high-quality tests.  Some examples:

  • Large educational assessment organizations like ACT
  • Governmental organizations like Singapore Examinations and Assessment Board
  • Professional certification and licensure boards like the International Federation of Boards of Biosafety
  • Employment testing companies like Biddle Consulting Group
  • Medical research like PROMIS
  • Universities like the University of Minnesota – mostly in purely academic roles
  • Language assessment groups like Berlitz
  • Testing services companies like ASC; such companies provide psychometric services and software to organizations that cannot afford to hire their own fulltime psychometrician.  This is often the case with certification and licensure boards.


Can Psychometricians Work Remotely?

Psychometricians can indeed work remotely, leveraging advances in technology and the growing acceptance of remote work across various industries. The core tasks of a psychometrician, such as data analysis, test development, and validation studies, can be effectively performed using statistical software and online collaboration tools. Remote work allows psychometricians to access large datasets, conduct complex analyses, and communicate findings with teams from virtually any location, ensuring that their work remains impactful and efficient.


Are All They Created Equal?

Absolutely not!  Like any other profession, there are levels of expertise and skill.  I liken it to top-level athletes: there are huge differences between what constitutes a good football/basketball/whatever player in high school, college, and the professional level.  And the top levels are quite elite; many people who study psychometrics will never achieve them.

Personally, I group psychometricians into three levels:

Level 1: Practitioners at this level are perfectly comfortable with basic concepts and the use of classical test theory, evaluating items and distractors with P and Rpbis.  They also do client-facing work like Angoff studies; many Level 2 and Level 3 psychometricians do not enjoy this work.

Level 2: Practitioners at this level are familiar with advanced topics like item response theory, differential item functioning, and adaptive testing.  They routinely perform complex analyses with software such as  Xcalibre.

Level 3: Practitioners at this level contribute to the field of psychometrics.  They invent new statistics/algorithms, develop new software, publish books, start successful companies, or otherwise impact the testing industry and science of psychometrics in some way.

Note that practitioners can certainly be extreme experts in other areas: someone can be an internationally recognized expert in Certification Accreditation or Pre-Employment Selection but only be a Level 1 psychometrician because that’s all that’s relevant for them.  They are a Level 3 in their home field.

Do these levels matter?  To some extent, they are just my musings.  But if you are hiring a psychometrician, either as a consultant or an employee, this differentiation is worth considering!

standard setting

If you have worked in the field of assessment and psychometrics, you have undoubtedly encountered the word “standard.” While a relatively simple word, it has the potential to be confusing because it is used in three (and more!) completely different but very important ways. Here’s a brief discussion.

Standard = Cutscore

As noted by the well-known professor Gregory Cizek here, “standard setting refers to the process of establishing one or more cut scores on a test.” The various methods of setting a cutscore, like Angoff or Bookmark, are referred to as standard setting studies. In this context, the standard is the bar that separates a Pass from a Fail. We use methods like the ones mentioned to determine this bar in as scientific and defensible fashion as possible, and give it more concrete meaning than an arbitrarily selected round number like 70%. Selecting a round number like that will likely get you sued since there is no criterion-referenced interpretation.

Standard = Blueprint

If you work in the field of education, you often hear the term “educational standards.” These refer to the curriculum blueprints for an educational system, which also translate into assessment blueprints, because you want to assess what is on the curriculum. Several important ones in the USA are noted here, perhaps the most common of which nowadays is the Common Core State Standards, which attempted to standardize the standards across states. These standards exist to standardize the educational system, by teaching what a group of experts have agreed upon should be taught in 6th grade Math classes for example. Note that they don’t state how or when a topic should be taught, merely that 6th Grade Math should cover Number Lines, Measurement Scales, Variables, whatever – sometime in the year.

Standard = Guideline

If you work in the field of professional certification, you hear the term just as often but in a different context, accreditation standards. The two most common are the National Commission for Certifying Agencies (NCCA) and the ANSI National Accreditation Board (ANAB). These two organizations are a consortium of credentialing bodies that give a stamp of approval to credentialing bodies, stating that a Certification or Certificate program is legit. Why? Because there is no law to stop me from buying a textbook on any topic, writing 50 test questions in my basement, and selling it as a Certification. It is completely a situation of caveat emptor, and these organizations are helping the buyers by giving a stamp of approval that the certification was developed with accepted practices like a Job Analysis, Standard Setting Study, etc.

In addition, there are the professional standards for our field. These are guidelines on assessment in general rather than just credentialing. Two great examples are the AERA/APA/NCME Standards for Educational and Psychological Measurement and the International Test Commission’s Guidelines (yes they switch to that term) on various topics.

Also: Standardized = Equivalent Conditions

The word is also used quite frequently in the context of standardized testing, though it is rarely chopped to the root word “standard.” In this case, it refers to the fact that the test is given under equivalent conditions to provide greater fairness and validity. A standardized test does NOT mean multiple choice, bubble sheets, or any of the other pop connotations that are carried with it. It just means that we are standardizing the assessment and the administration process. Think of it as a scientific experiment; the basic premise of the scientific method is holding all variables constant except the variable in question, which in this case is the student’s ability. So we ensure that all students receive a psychometrically equivalent exam, with equivalent (as much as possible) writing utensils, scrap paper, computer, time limit, and all other practical surroundings. The problem comes with the lack of equivalence in access to study materials, prep coaching, education, and many bigger questions… but those are a societal issue and not a psychometric one.

So despite all the bashing that the term gets, a standardized test is MUCH better than the alternatives of no assessment at all, or an assessment that is not a level playing field and has low reliability. Consider the case of hiring employees: if assessments were not used to provide objective information on applicant skills and we could only use interviews (which are famously subjective and inaccurate), all hiring would be virtually random and the amount of incompetent people in jobs would increase a hundredfold. And don’t we already have enough people in jobs where they don’t belong?

Polytomous IRF from FastTest

The generalized partial credit model (GPCM, Muraki 1992) is an item response theory (IRT) model designed to work with items that are partial credit.  That is, instead of just right/wrong as possible, scoring an examinee can receive partial points for completing some aspects of the item correctly.  For example, a typical multiple-choice item is scored as 0 points for incorrect and 1 point for correct.  A GPCM item might consist of 3 aspects and be 0 points for incorrect, 3 points for fully correct, and 1 or 2 points if the examinee only completes 1 or 2 of the aspects, but not all three. 

Examples of GPCM items

GPCM items, therefore contain multiple point levels starting at 0.  There are several examples that are common in the world of educational assessment.

The first example, which nearly everyone is familiar with, is essay rubrics.  A student might be instructed to write an essay on why extracurriculars are important in school, with at least 3 supporting points.  Such an essay might be scored with the number of points presented (0,1,2,3) as well as on grammar (0=10 or more errors, 1= 3-9 errors, and 2 = 2 errors or less). Here’s a shorter example.

Another example is multiple response items.  For example, a student might be presented with a list of 5 animals and be asked to identify which are Mammals.  There are 2 correct answers, so the possible points are 0,1,2.

Note that this also includes their tech-enhanced equivalents, such as drag and drop; such items might be reconfigured to dragging the animal names into boxes, but that’s just window dressing to make the item look sexier.

The National Assessment of Educational Progress and many other K-12 assessments utilize the GPCM since they so often use item types like this.

Why use the generalized partial credit model?

Well, the first part of the answer is a more general question: why use polytomous items?  Well, these items are generally regarded to be higher-fidelity and assess deeper thinking than multiple-choice items. They also provide much more information than multiple-choice items in an IRT paradigm.

The second part of the answer is the specific question: If we have polytomous items, why use the GPCM rather than other models? 

There are two parts to that answer that refer to the name generalized partial credit model.  First, partial credit models are appropriate for items where the scoring starts at 0, and different polytomous items could have very different performances.  In contrast, Likert-style items are also polytomous (almost always), but start at 1, and apply the same psychological response process on every item.  For example, a survey where statements are presented and examinees are to, “Rate each on a scale of 1 to 5.” 

Second, the “generalized” part of the name means that it includes a discrimination parameter for evaluating the measurement quality of an item.  This is similar to using the 2PL or 3PL for dichotomous items rather than using the Rasch model and assuming items are of equal discrimination.  There is also a Rasch partial credit model that is equivalent and can be used alongside Rasch dichotomous items, but this post is just focusing on GPCM.

Definition of the Generalized Partial Credit Model

The equation below (Embretson & Reise, 2000) defines the generalized partial credit.

Generalized partial credit model equation 

In this equation: 

  m – number of possible points

  x – the student’s score on the item

  i – index for item

  θ – student ability

  a – discrimination parameter for item i

  gij – the boundary parameter for step j on item i; there are always m-1 boundaries

  r – an index used to manage the summation.

What do these mean?  The a parameter is the same concept as the a parameter in dichotomous IRT, where 0.5 might be low and 1.2 might be high.  The boundary parameters define the steps or thresholds that explain how the GPCM works, which will become clearer when you see the graph below.

As an example, let us consider a 4-point item with the following parameters.

GPCM parameters

If you use those numbers to graph the functions for each point level as a function of theta, you would see a graph like the one below.  Here, consider Option 1 to be the probability of getting 0 points; this is a very high probability for the lowest examinees but drops as ability increases.

Generalized-partial-credit-model

The Option 5 line is for receiving all possible points; high probability for the best examinees, but probability decreases as ability does.  Between, we have probability curves for 1, 2, and 3 points.  If an examinee has a theta of -0.5, they have a high probability of getting 2 points on the item (yellow curve).  If their theta is 1.0, they are likely to get 3 points (pink).

The boundary parameters mentioned earlier have a very real interpretation with this graph; they are literally the boundaries between the curves.  That is the theta level, at which 1 point (purple) becomes more likely that 0 points (red) are at -2.4 where the two lines cross.  Note that this is the first boundary parameter b1 in the image earlier.

How to use the GPCM

As mentioned before, the GPCM is appropriate to use as your IRT model for multi-point items in an educational context, as opposed to Likert-style psychological items.  They’re almost always used in conjunction with the 2PL or 3PL dichotomous models; consider a test of 25 multiple-choice items, 3 multiple response items, and an essay with 2 rubrics.

To implement, you need an IRT software program that can estimate dichotomous and polytomous items jointly, such as Xcalibre.  Consider the screenshot below to specify these. 

Xcalibre-IRT-model-selection

If you implement IRT with Xcalibre, it produces a page like this for each GPCM item.  Here, we have an item that is scored 0 to 3 points.  Most students get 3 points, so it is very easy.  Very few get 0 or 1 points.  For this reason, the boundary to get all three points is -0.339, which is below average.  Note that the two lower boundaries are not in the correct order; so few examinees answered these that the system had a difficult time estimating where the boundary was!  This leads to another good point: you will need large sample sizes (at least 500-1000) to implement this model effectively.

Xcalibre item response theory

To score students with the GPCM, you either need to use the IRT program like Xcalibre to score students or a test delivery system that has been specifically designed to support the GPCM in the item banker and implement GPCM in scoring routines.  The former only works when you are doing the IRT analysis after all examinees have completed a test; if you have a continuous deployment of assessments, you will need to use the latter approach.

Where can I learn more?

IRT textbooks will provide a treatment of polytomous models like the generalized partial credit model. Examples are de Ayala (2010) and Embretson & Reise (2000). Also, I recommend the 2010 book by Nering and Ostini, which was previously available as a monograph.

r-for-psychometrics

If you are dealing with data science, which psychometrics most definitely is, you’ve probably come across  R. It is an environment that allows you to implement packages for many different types of analysis, which are built by a massive community of data scientists around the world.

R has become one of the two main languages for data science and machine learning (the other being Python) and its popularity has grown drastically.   R for psychometrics is also becoming common.

I was extremely anti-R for several years, but have recently started using it for several important reasons.  However, for some even more important reasons, I don’t use it for all of my work.  I’d recommend you do the same.


What is R?

R is a programming language-like environment for statistical analysis.  Its Wikipedia page defines it as a “programming language and free software environment for statistical computing and graphics”. But I use the term “programming-language-like environment”.

This is because it is more like command scripting from DOS than an actual compiled language like Java or Pascal.  R has an extremely steep learning curve compared to software that provides a decent UI; it claims that RStudio is a UI, but it really is just a more advanced window to see the same command code!

R can be maddening for several reasons.  For example, it will not recognize a missing value in data when running a simple correlation and is unable to give you a decent error message explaining this.  This was my first date with R, and turned me off for years.  A similar thing occurred to me the first time I used PARSCALE in 2009 and couldn’t get it to work for days.  Eventually,, I discovered it was because the original codebase was DOS, which limits you to 8-character-file names, which is nowhere in the documentation!  They literally expected all users to be knowledgeable on 1980s DOS rules in 2009.

BUT… R is free, and everybody likes free.  Even though free never means there is no cost.

What are packages?

R comes with some analysis out of the box, but the vast majority is available in packages.  For example, if you want to do factor analysis or item response theory, you install one of several packages that do those.  These packages are written by contributors and uploaded to an R server somewhere.

There is no code review or anything else to check the packages, so it is entirely a caveat emptor situation.  This isn’t malicious, they’re just taking the scientific approach that assumes other researchers will replicate, disprove, or alternative work.

For important, commonly used packages (I am a huge fan of caret), this is most definitely the case.  For rarely used packages and pet projects, it is the opposite.


Why do I use R for psychometrics or elsewhere?

As mentioned earlier, I use R when there are well-known packages that are accepted in the community.  The caret package is a great example.  Just Google “r caret” and you can get a glimpse of the many resources, blog posts, papers, and other uses of the package.  It isn’t an analysis package usually, it just makes it easier to call existing, proven packages.  Another favorite is the text2vec package, and of course, there is the ubiquitous tidyverse.

I love to use R in cases of more general data science problems because this means a community several orders of magnitude above psychometricians, which definitely contributes to the higher quality.  The caret package is for regression and classification, which are used in just about every field.

The text2vec package is for natural language processing, used in fields as diverse as marketing, political science, and education.  One of my favorite projects I’ve heard come across was the analysis of the Jane Austen corpus.  Fascinating.

When would I use R packages that I might consider less stellar?

I don’t mind using R when it is a low-stakes situation such as exploratory data analysis for a client.  I would also consider it an acceptable alternative to commercial software when the analysis is something I do very rarely.  No way am I going to pay $10,000 or whatever for something I do 2 hours per year.

Finally, I would consider it for niche analyses where no other option exists except to write my own code, and it does not make financial sense to do so.  However, in these cases I still try to perform due diligence.

Why I don’t Use R

Often it comes down to a single word: quality.

For niche packages, the code might be 100% from a grad student who was a complete newbie on a topic for their thesis, with no background in software development or ancillary topics like writing a user manual.   Moreover, no one has ever validated a single line of the code.  Because of this, I am very wary when using R packages.

If you use one like this, I highly recommend you do some QA or background research on it first!   I would love it if R had a community rating system like exists for WordPress plugins.  With those, you can see that one plugin might be used on 1,000,000 sites with a 4.5/5.0 rating, while another is used on 43 sites with a 2.7/5.0 rating.

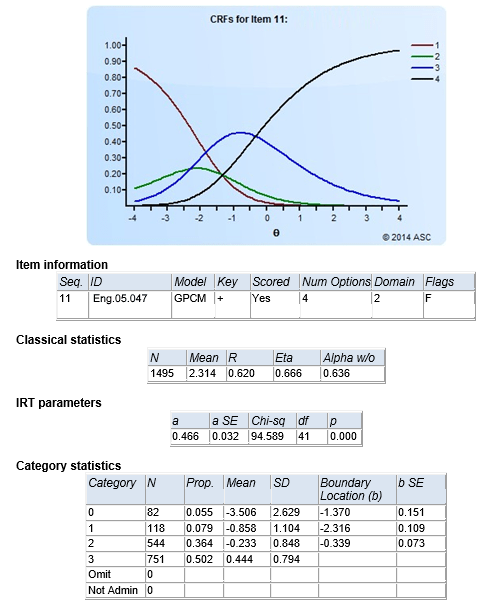
This quality thing is of course a continuum.  There is a massive gap between the grad student project and something like caret.  In between, you might have an R package that is a hobby of a professor who devotes some time to it and has extremely deep knowledge of the subject matter—but it remains a part-time endeavor by someone with no experience in commercial software.  For example of this situation, please see this comparison of IRT results with R vs professional tools.

The issue on User Manuals is of particular concern to me as someone that provides commercial software and knows what it is like to support users.  I have seen user manuals in the R world that literally do not tell the users how to use the package.  They might provide a long-winded description of some psychometrics, obviously copied from a dissertation, as a “manual”, when at best it only belongs as an appendix.  No info on formatting of input files, no provision of example input, no examples of usage, and no description of interpreting the output.

Even in the cases of an extremely popular package that has high-quality code, the documentation is virtually unreadable.  Check out the official landing page for tidyverse.  How welcoming is that?  I’ve found that the official documentation is almost guaranteed to be worthless – instead, head over to popular blogs or YouTube channels on your favorite topic.

The output is also famously below average regarding quality.

R stores its output as objects, a sort of mini-database behind the scenes.  If you want to make graphs or dump results to something like a CSV file, you have to write more code just for such basics.  And if you want a nice report in Word or PDF, get ready to write a ton of code, or spend a week doing copy-and-paste.  I noticed that there was a workshop a few weeks ago at NCME (April 2019) that was specifically on how to get useful output reports from R, since this is a known issue.

Is R turning the corner?

I’ve got another post coming about R and how it has really turned the corner because of 3 things: Shiny, RStudio, and availability of quality packages.  More on that in the future, but for now:

  • Shiny allows you to make applications out of R code so that the power of R can be available to end-users without them having to write & run code themselves.  Until Shiny, R was limited to people who wanted to write & run code.
  • RStudio makes it easier to develop R code, by overlaying an integrated development environment (IDE) on top of R.  If you have ever used and IDE, you know how important this is.  You’ve got to be incredibly clueless to not use an IDE for development.  Yet the first release of RStudio did not happen until 2011.  This shows how rooted R was in academia.
  • As you might surmise from my rant above, it is the quality packages (and third-party documentation!) that are really opening the floodgates.

Another hope for  R is jumping on the bandwagon of the API economy.  It might become the lingua franca of the data analytics world from an integration perspective.  This might be the true future of R for psychometrics.

But there are still plenty of issues.  One of my pet peeves is the lack of quality error trapping.  For example, if you do simple errors, the system will crash with completely worthless error messages.  I found this to happen if I run an analysis, open my output file, and run it again when forgetting to close the output file.  As previously mentioned, there is also the issue with a single missing data point in a correlation.

Nevertheless, R is still not really consumer facing.  That is, actual users will always be limited to people that have strong coding skills AND deep content knowledge on a certain area of data science or psychometrics.  Just like there will always be a home for more user-friendly statistical software like SPSS, there will always be a home for true psychometric software like Xcalibre.

job analysis

Subject matter experts are an important part of the process in developing a defensible exam.  There are several ways that their input is required.  Here is a list from highest involvement/responsibility to lowest:

  1. Serving on the Certification Committee (if relevant) to decide important things like eligibility pathways
  2. Serving on panels for psychometric steps like Job Task Analysis or Standard Setting (Angoff)
  3. Writing and reviewing the test questions
  4. Answering the survey for the Job Task Analysis


Who are Subject Matter Experts?

A subject matter expert (SME) is someone with knowledge of the exam content.  If you are developing a certification exam for widgetmakers, you need a panel of expert widgetmakers, and sometimes other stakeholders like widget factory managers.

You also need test development staff and psychometricians.  Their job is to guide the process to meet international standards, and make the SME time the most efficient.

Example: Item Writing Workshop

psychometric training and workshopsThe most obvious usage of subject matter experts in exam development is item writing and review. Again, if you are making a certification exam for experienced widgetmakers, then only experienced widgetmakers know enough to write good items.  In some cases, supervisors do as well, but then they are also SMEs.  For example, I once worked on exams for ophthalmic technicians; some of the SMEs were ophthalmic technicians, but some of the SMEs (and much of the nonprofit board) were ophthalmologists, the medical doctors for whom the technicians worked.

An item writing workshop typically starts with training on item writing, including what makes a good item, terminology, and format.  Item writers will then author questions, sometimes alone and sometimes as a group or in pairs.  For higher stakes exams, all items will then be reviewed/edited by other SMEs.

Example: Job Task Analysis

Job Task Analysis studies are a key step in the development of a defensible certification program.  It is the second step in the process, after the initial definition, and sets the stage for everything that comes afterward.  Moreover, if you seek to get your certification accredited by organizations such as NCCA or ANSI, you need to re-perform the job task analysis study periodically. JTAs are sometimes called job analysis, practice analysis, or role delineation studies.

The job task analysis study relies heavily on the experience of Subject Matter Experts (SMEs), just like Cutscore studies. The SMEs have the best tabs on where the profession is evolving and what is most important, which is essential both for the initial JTA and the periodic re-set of the exam. The frequency depends on how quickly your field is evolving, but a cycle of 5 years is often recommended.

The goal of the job task analysis study is to gain quantitative data on the structure of the profession.  Therefore, it typically utilizes a survey approach to gain data from as many professionals as possible.  This starts with a group of SMEs generating an initial list of on-the-job tasks, categorizing them, and then publishing a survey.  The end goal is a formal report with a blueprint of what knowledge, skills, and abilities (KSAs) are required for certification in a given role or field, and therefore what are the specifications of the certification test.

  • Observe— Typically the psychometrician (that’s us) shadows a representative sample of people who perform the job in question (chosen through Panel Composition) to observe and take notes. After the day(s) of observation, the SMEs sit down with the observer so that he or she may ask any clarifying questions.

    The goal is to avoid doing this during the observation so that the observer has an untainted view of the job.  Alternatively, your SMEs can observe job incumbents – which is often the case when the SMEs are supervisors.

  • Generate— The SMEs now have a corpus of information on what is involved with the job, and generate a list of tasks that describe the most important job-related components. Not all job analysis uses tasks, but this is the most common approach in certification testing, hence you will often hear the term job task analysis as a general term.
  • Survey— Now that we have a list of tasks, we send a survey out to a larger group of SMEs and ask them to rate various features of each task.

    How important is the task? How often is it performed? What larger category of tasks does it fall into?

  • Analyze— Next, we crunch the data and quantitatively evaluate the SMEs’ subjective ratings to determine which of the tasks and categories are most important.

  • Review— As a non-SME, the psychometrician needs to take their findings back to the SME panel to review the recommendation and make sure it makes sense.

  • Report— We put together a comprehensive report that outlines what the most important tasks/categories are for the given job.  This in turn serves as the foundation for a test blueprint, because more important content deserves more weight on the test.

    This connection is one of the fundamental links in the validity argument for an assessment.


Example: Cutscore studies

When the JTA is completed, we have to determine who should pass the assessment, and who should fail. This is most often done using the modified Angoff process, where the SMEs conceptualize a minimally competent candidate (MCC) and then set pass/fail point so that the MCC would just barely pass.  There are other methods too, such as Bookmark or Contrasting Groups.

For newly-launching certification programs, these processes go hand-in-hand with item writing and review. The use of evidence-based practices in conducting the job task analysis, test design, writing items, and setting a cutscore serve as the basis for a good certification program.  Moreover, if you are seeking to achieve accreditation – a third part stamp of approval that your credential is high quality – documentation that you completed all these steps is required.

Performing these tasks with a trained psychometrician inherently checks a lot of boxes on the accreditation to-do list, which can position your organization well for the future. When it comes to accreditation— the psychometricians and measurement specialists at Assessment Systems have been around the block a time or two. We can walk you through the lengthy process of becoming accredited, or we can help you perform these tasks a la carte.

school-teacher-teaching-a-class

One of the most cliche phrases associated with assessment is “teaching to the test.”  I’ve always hated this phrase, because it is only used in a derogatory matter, almost always by people who do not understand the basics of assessment and psychometrics.  I recently saw it mentioned in this article on PISA, and that was one time too many, especially since it was used in an oblique, vague, and unreferenced manner.

So, I’m going to come out and say something very unpopular: in most cases, TEACHING TO THE TEST IS A GOOD THING.

Why teaching to the test is usually a good thing

If the test reflects the curriculum – which any good test will – then someone who is teaching to the test will be teaching to the curriculum. Which, of course, is the entire goal of teaching. The phrase “teaching to the test” is used in an insulting sense, especially because the alliteration is resounding and sellable, but it’s really not a bad thing in most cases.  If a curriculum says that 4th graders should learn how to add and divide fractions, and the test evaluates this, what is the problem? Especially if it uses modern methodology like adaptive testing or tech-enhanced items to make the process more engaging and instructional, rather than oversimplifying to a text-only multiple choice question on paper bubble sheets?

The world of credentialing assessment, this is an extremely important link.  Credential tests start with a job analysis study, which surveys professionals to determine what they consider to be the most important and frequently used skills in the job.  This data is then transformed into test blueprints. Instructors for the profession, as well as aspiring students that are studying to pass the test, then focus on what is in the blueprints.  This, of course, still contains the skills that are most important and frequently used in the job!

So what is the problem then?

Now, telling teachers how to teach is more concerning, and more likely to be a bad thing.  Finland does well because it gives teachers lots of training and then power to choose how they teach, as noted in the PISA article.

As a counterexample, my high school math department made an edict starting my sophomore year thaborderline method educational assessmentt all teachers had to use the “Chicago Method.” It was pure bunk and based on the fact that students should be doing as much busy work as possible instead of the teachers actually teaching. I think it is because some salesman convinced the department head to make the switch so that they would buy a thousand brand new textbooks.  The method makes some decent points (here’s an article from, coincidentally, when I was a sophomore in high school) but I think we ended up with a bastardization of it, as the edict was primarily:

  1. Assign students to read the next chapter in class (instead of teaching them!); go sit at your desk.
  2. Assign students to do at least 30 homework questions overnight, and come back tomorrow with any questions they have.
  3. Answer any questions, then assign them the next chapter to read.  Whatever you do, DO NOT teach them about the topic before they start doing the homework questions.  Go sit at your desk.

Isn’t that preposterous?  Unsurprisingly, after two years of this, I went from being a leader of the Math Team to someone who explicitly said “I am never taking Math again”.  And indeed, I managed to avoid all math during my senior year of high school and first year of college. Thankfully, I had incredible professors in my years at Luther College, leading to me loving math again, earning a math major, and applying to grad school in psychometrics.  This shows the effect that might happen with “telling teachers how to teach.” Or in this case, specifically – and bizarrely – to NOT teach.

What about all the bad tests out there?

Now, let’s get back to the assumption that a test does reflect a curriculum/blueprints.  There are, most certainly, plenty of cases where an assessment is not designed or built well.  That’s an entirely different problem, and is an entirely valid concern. I have seen a number of these in my career.  This danger why we have international standards on assessments, like AERA/APA/NCME and NCCA.  These provide guidelines on how a test should be build, sort of like how you need to build a house according to building code and not just throwing up some walls and a roof.

ansi accreditation certification exam candidates

For example, there is nothing that is stopping me from identifying a career that has a lot of people looking to gain an edge over one another to get a better job… then buying a textbook, writing 50 questions in my basement, and throwing it up on a nice-looking website to sell as a professional certification.  I might sell it for $395, and if I get just 100 people to sign up, I’ve made $39,500!!!! This violates just about every NCCA guideline, though. If I wanted to get a stamp of approval that my certification was legit – as well as making it legally defensible – I would need to follow the NCCA guidelines.

My point here is that there are definitely bad tests out there, just like there are millions of other bad products in the world.  It’s a matter of caveat emptor. But just because you had some cheap furniture on college that broke right away, doesn’t mean you swear off on all furniture.  You stay away from bad furniture.

There’s also the problem of tests being misused, but again that’s not a problem with the test itself.  Certainly, someone making decisions is uninformed. It could actually be the best test in the world, with 100% precision, but if it is used for an invalid application then it’s still not a good situation.  For example, if you took a very well-made exam for high school graduation and started using it for employment decisions with adults. Psychometricians call this validity – that we have evidence to support the intended use of the test and interpretations of scores.  It is the #1 concern of assessment professionals, so if a test is being misused, it’s probably by someone without a background in assessment.

So where do we go from here?

Put it this way, if an overweight person is trying to become fitter, is success more likely to come from changing diet and exercise habits, or from complaining about their bathroom scale?  Complaining unspecifically about a high school graduation assessment is not going to improve education; let’s change how we educate our children to prepare them for that assessment, and ensure that the assessment reflects the goals of the education.  Nevertheless, of course, we need to invest in making the assessment as sound and fair as we can – which is exactly why I am in this career.

two-parameter-irt-model

Item response theory is the predominant psychometric paradigm for mid or large scale assessment.  As noted in my introductory blog post, it is actually a family of models.  In this post, we discuss the two parameter IRT model (IRT 2PL).

Consider the following 3PL equation (simplified from Hambleton & Swaminathan, 1985, Eq. 3.3).  The IRT 2PL simply removes the c and (1-c) elements, so that probability is only a function of a and b.

3PL irt equation

This equation is predicting the probability of a certain response based on the examinee trait/ability level, the item discrimination parameter a, and the item difficulty/location parameter b.  If the examinee’s trait level is higher than the item location, the person has more than a 50% chance of responding in the keyed direction.

This phrase “in the keyed direction” is one you might often hear with the IRT 2PL.  This is because it is not often used with education/knowledge/ability assessments where items usually have a correct answer and guessing is often possible.  The IRT 2PL is used more often in attitudinal or other psychological assessments where guessing is irrelevant and there is no correct answer.  For example, consider an Extroversion scale, where examinees are responding Yes/No to statements like “I love to go to parties” or “I prefer to read books in my free time.”  There is not much to guess here, and the sense of “correct” is not relevant.

However, it is quite clear that the first statement is keyed in the direction of extroversion while the second statement is the reverse.  In fact, you would get the 1 point of response for saying No to that statement rather than Yes.  This is often called reverse-scored.

There are other aspects that go into whether you should use the 2PL model, but this is one of the most important.  In addition, you should also examine model fit indices and take sample size into account.

How do I implement the two parameter IRT model?

Like other IRT models, the 2PL requires specialized software.  Not all statistical packages will do it.  And while you can easily calculate classical statistics in Excel, there is no way to do IRT (well, unless you want to write your own VBA programs to do so).  As mentioned in this article on the three parameter model, there are a lot of IRT software programs available, but not all meet the required standards.

You should evaluate cost and functionality.  If you are a fan of R, there are packages to estimate IRT there.  However, I recommend our Xcalibre program for both newbies and professionals.  For newbies, it is much easier to use, which means you spend more time learning the concepts of IRT and not fighting command code that might be 30 years old.  For professionals, Xcalibre saves you from having to create reports by copy and paste which is incredibly expensive.

three-parameter-irt-model

Item response theory (IRT) is an extremely powerful psychometric paradigm that addresses many of the inadequacies of classical test theory (CTT).  If you are new to the topic, there is a broad intro here, where you will learn that IRT is actually a family of mathematical models rather than one specific one.  Today, I’m talking about the 3PL.

One of the most commonly used models is called the three parameter IRT model (3PM), or the three parameter logistic model (3PL or 3PLM) because it is almost always expressed in a logistic form.  The equation for this is below (Hambleton & Swaminathan, 1985, Eq. 3.3).

3PL irt equation


Like all IRT models, it is seeking to predict the probability of a certain response based on examinee ability/trait level and some parameters which describe the performance of the item.  With the 3PL, those parameters are a (discrimination), b (difficulty or location), and c (pseudo-guessing).  For more on these, check out the descriptions in my general IRT article.

The remaining point then is what we mean by the probability of a certain response.  The 3PL is a dichotomous model which means that it is predicting a binary outcome such as correct/incorrect or agree/disagree.

When should I use the three parameter IRT model?

The applicability of the 3PL to a certain assessment depends on the relevance of the components just discussed.  First, the response to the items must be binary.  This eliminates Likert-type items (“Rate on a scale of 1 to 5”), partial credit items (scoring an essay as 0 to 5 points), and performance assessments where scoring might include a range of points, deductions, or timing (number of words typed per minute).

Next, you should evaluate the applicability of the use of all three parameters.  Most notably, are the items in your assessment susceptible to guessing?  Because the thing that differentiates the 3PL from its sisters the 1PL and 2PL is that it attempts to model for guessing.  This, of course, is highly relevant for multiple-choice items on knowledge or ability assessments, so the 3PL is often a great fit for those.

Even in this case, though, there are a number of practitioners and researchers that still prefer to use the 1PL or 2PL models.  There are some deeper methodological issues driving this choice.  The 2PL is sometimes chosen because it works well with an estimation method called Joint Maximum Likelihood.

The 1PL, also known as the Rasch model (yes, I know the Rasch people will say they are not the same, I am grouping them together for simplicity in comparison), is often selected because adherents to the model believe in certain advantages such as it providing “objective measurement.”  Also, the Rasch model works far better for smaller samples (see this technical report by Guyer & Thompson and this one by Yoes).  Regardless, you should probably evaluate model fit when selecting models.

I am from a camp that is pragmatic in choice rather than dogmatic.  While training on the 3PL in graduate school, I have no qualms against using the 2PL or 1PL/Rasch if the test type and sample size warrant it or if fit statistics indicate they are sufficient.

How do I implement the three parameter IRT model?

If you want to implement the three parameter IRT model, you need specialized software.  General statistical software such as SPSS does not always produce IRT analysis, though some do.  Even in the realm of IRT-specific software, not all produce the 3PL.  And, of course, the software can vary greatly in terms of quality.  Here are three important ways it can vary:

  1. Accuracy of results: check out this research study which shows that some programs are inaccurate
  2. User-friendliness: some programs require you to write extensive code, and some have a purely graphical interface
  3. Output usability and interpretability: some programs just give simple ASCII text, others provide extensive Word or HTML reports with many beautiful tables and graphs.

For more on this topic, head over to my post on how to implement IRT in general.

Want to get started immediately?  Download a free copy of our IRT software Xcalibre.