Psychometric tests are assessments of people to measure psychological attributes such as personality or intelligence. Over the past century, psychometric tests have played an increasingly important part in revolutionizing how we approach important fields such as education, psychiatry, and recruitment. One of the main reasons why psychometric tests have become popular in corporate recruitment and education is their accuracy and objectivity.
However, getting the best out of psychometric tests requires one to have a concrete understanding of what they are, how they work, and why you need them. This article, therefore, aims to provide you with the fundamentals of psychometric testing, the benefits, and everything else you need to know.
Interested in talking to a psychometrician about test development and validation, or a demo of our powerful platform that empowers you to develop custom psychometric tests?

What is a psychometric test or assessment?
Psychometric tests and assessments are different from other types of tests in that they measure a person’s knowledge, abilities, interests, and other attributes. They focus on measuring “mental processes” rather than “objective facts.” Psychometric tests are used to determine suitability for employment, education, training, or placement, as well as the suitability of the person for specific situations.
A psychometric test or assessment is an evaluation of a candidate’s personality traits and cognitive abilities. They also help assess mental health status by screening the individual for potential mental disorders. In recruitment and job performance, companies use psychometric tests for reasons such as:
- Make data-driven comparisons among candidates
- Making leadership decisions
- Reduce hiring bias and improve workforce diversification
- Identify candidate strengths and weaknesses
- Help complete candidate personas
- Deciding management strategies
Psychometrics is different, and refers to a field of study associated with the theory and technique of psychoeducational measurement. It is not limited to the topic of recruitment and careers, but spans all assessments, from K-12 formative assessment to addiction inventories in medical clinics to university admissions to certification of nurses.
The different types of psychometric tests
The following are the main types of psychometric assessments:
Personality tests
Personality tests mainly help recruiters identify desirable personality traits that would make one fit for a certain role in a company. These tests contain a series of questions that measure and categorize important metrics such as leadership capabilities and candidate motivations as well as job-related traits such as integrity or conscientiousness. Some personality assessments seek to categorize people into relatively arbitrary “types” while some place people on a continuum of various traits.
‘Type focused’ Personality tests
Some examples of popular psychometric tests that use type theory include the Myers-Briggs Type Indicator (MBTI) and the DISC profile. Personality types are of limited usefulness in recruitment because they lack objectivity and reliability in determining important metrics that can predict the success of certain candidates in a specific role, as well as having more limited scientific backing. They are, to a large extent, Pop Psychology.
‘Trait-focused’ personality types
Personality assessments based on trait theory on the other hand tend to mainly rely on the OCEAN model, like the NEO-PI-R. These psychometric assessments determine the intensity of five traits; openness, conscientiousness, extraversion, agreeableness, and neuroticism, using a series of questions and exercises. Psychometric assessments based on this model provide more insight into the ability of candidates to perform in a certain role, compared to type-focused assessments.
Cognitive Ability and Aptitude Tests
Cognitive ability tests, also known as intelligence tests or aptitude, measure a person’s latent/unlearned cognitive skills and attributes. Common examples of this are logical reasoning, numerical reasoning, and mechanical reasoning. It is important to stress that these are generally unlearned, as opposed to achievement tests.
Job Knowledge and Achievement tests
These psychometric tests are designed to assess what people have learned. For example, if you are applying for a job as an accountant, you might be given a numerical reasoning or logical reasoning test, and a test in the use of Microsoft Excel. The former is aptitude, while the latter is job knowledge or achievement. (Though there is certainly some learning involved with basic math skills).
What are the importance and benefits of psychometric tests?
Psychometric tests have been proven to be effective in domains such as recruitment and education. In recruitment, psychometric tests have been integrated into pre-employment assessment software because of their effectiveness in the hiring process. Here are several ways psychometric tests are beneficial in corporate environments, along with Learning and Development (L & D):
Cost and Time Efficiency — Psychometric tests save organizations a lot of resources because they help eliminate the guesswork in hiring processes. Psychometric tests help employers go through thousands of resumes to find the perfect candidates.
Cultural fulfillment — In the modern business world, culture is a great determinant of success. Through psychometric tests, employees can predict the types of candidates that can fit into their company culture.
Standardization — Traditional hiring processes have a lot of hiring bias cases. However, psychometric tests can level the playing ground and give a chance for the best candidates to get what they deserve.
Effectiveness — Psychometric tests have been scientifically proven to play a critical role in hiring the best talent. This is mainly because they can spot important attributes that can’t be spotted by traditional hiring processes.
In L&D, psychometric tests can help organizations generate important insights such as learning abilities, candidate strengths and weaknesses, and learning strategy effectiveness. This can help re-write the learning strategies, for improved ROI.
What makes a good psychometric test?
As with all tests, you need reliability and validity. In the case of pre-employment testing, the validity is usually one of two things:
- Content validity via job-relatedness; if the job requires several hours per day of Microsoft Excel, then a test on Microsoft Excel makes sense
- Predictive validity: numerical reasoning but not be as overtly related to the job as Microsoft Excel, but if you can show that it predicts job performance, then this is helpful. This is especially true for noncognitive assessments like conscientiousness.
Conclusion
There is no doubt that psychometric tests are important in essential aspects of life such as recruitment and education. Not only do they help us understand people, but also simplify the hiring process. However, psychometric tests should be used with caution. It’s advisable to develop a concrete strategy on how you are going to integrate them into your operation mechanism.
Ready To Start Developing Your Own Psychometric Tests?
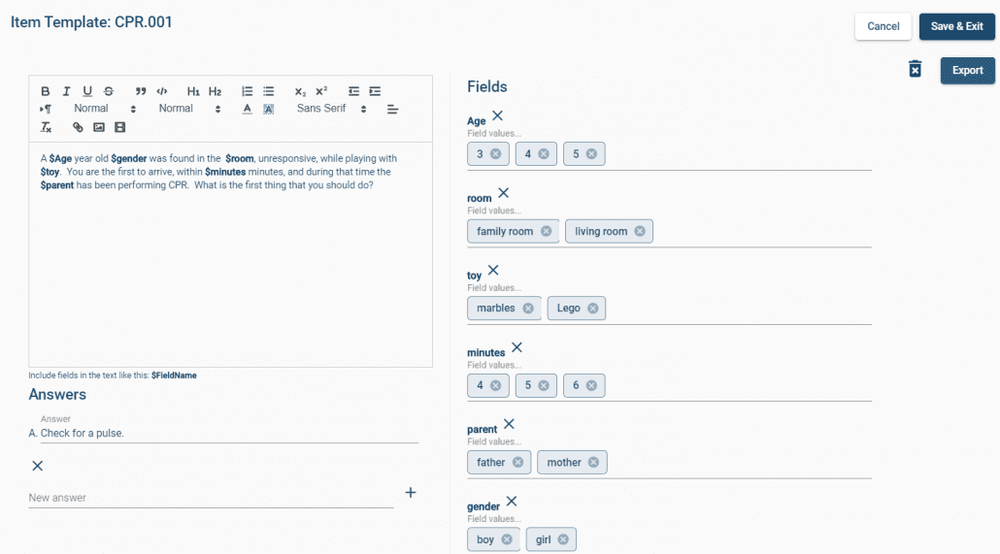
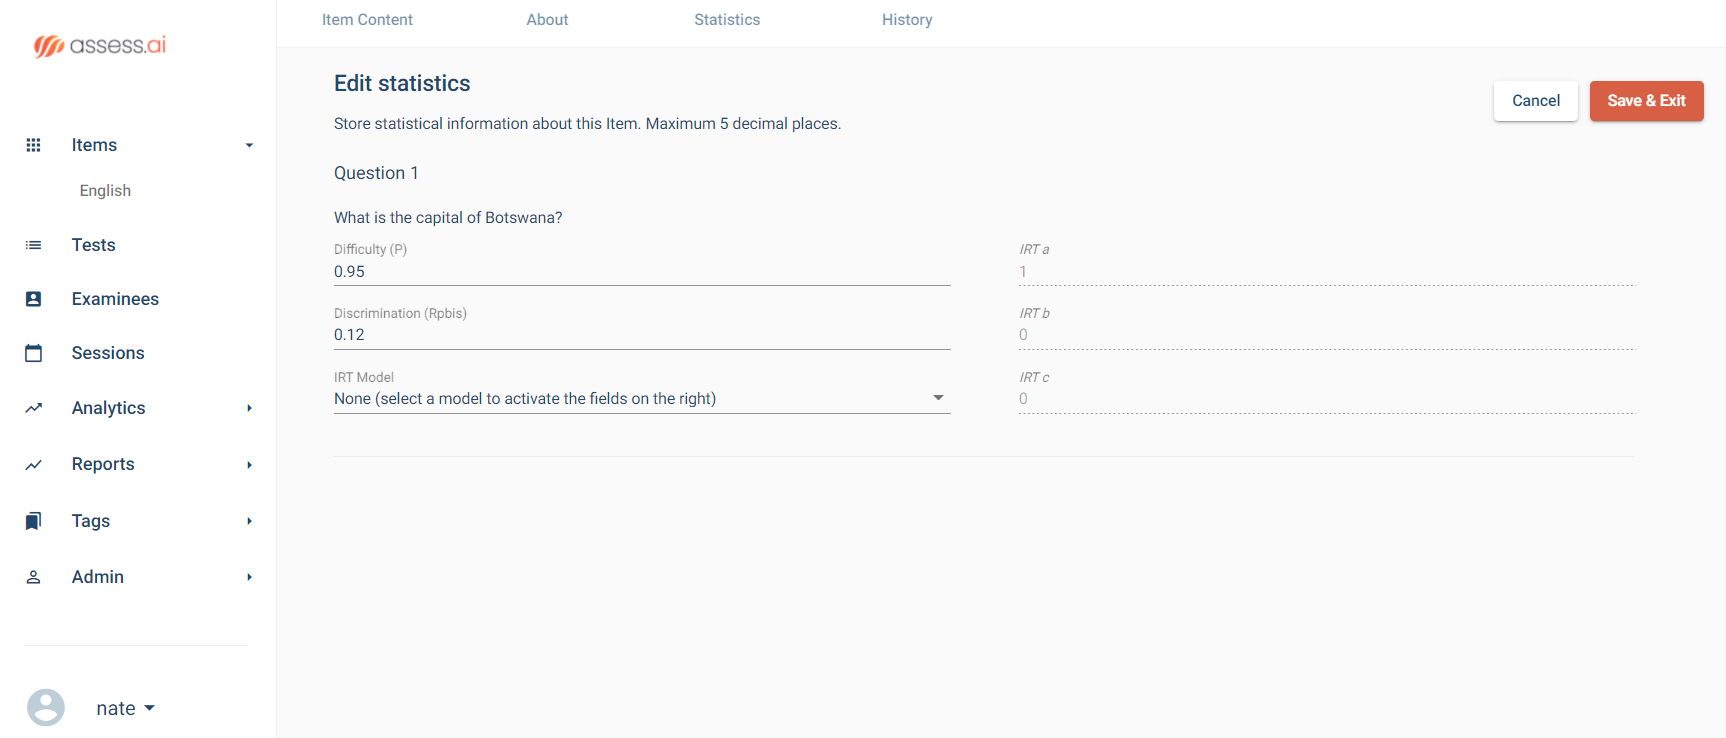
 ASC’s comprehensive platform provides you with all the tools necessary to develop and securely deliver psychometric assessments. It is equipped with powerful psychometric software, online essay marking modules, advanced reporting, tech-enhanced items, and so much more! You also have access to the world’s greatest psychometricians to help you out if you get stuck in the process!


 Offline exams have been a stepping stone towards the development of modern assessment models that are more effective. We can’t ignore the fact that there are several advantages of traditional exams.